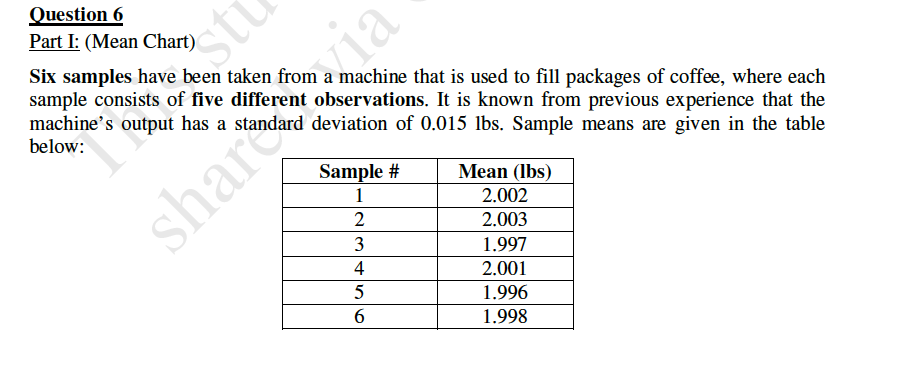
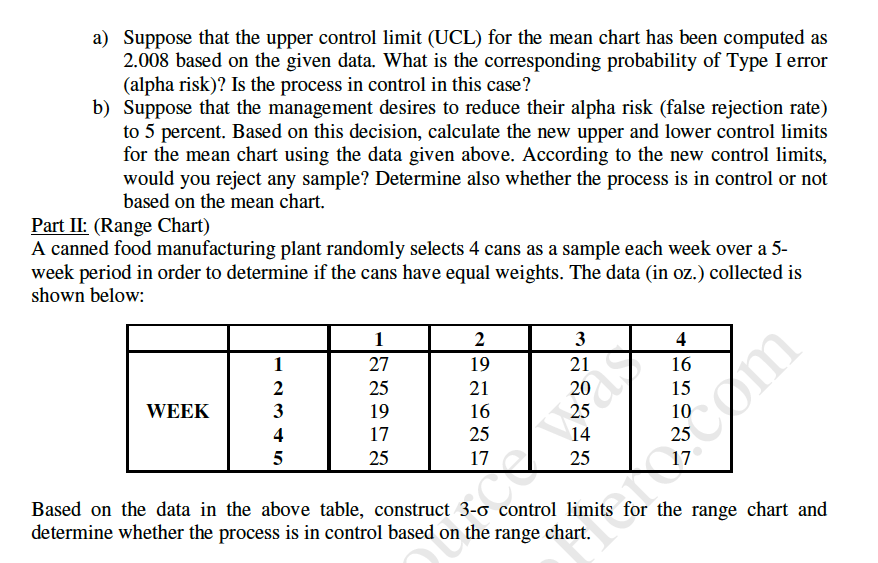
Question: St Question 6 Part I: (Mean Chart) Six samples have been taken from a machine that is used to fill packages of coffee, where each

St Question 6 Part I: (Mean Chart) Six samplesSt Question 6 Part I: (Mean Chart) Six samples

St Question 6 Part I: (Mean Chart) Six samples have been taken from a machine that is used to fill packages of coffee, where each sample consists of five different observations. It is known from previous experience that the machine's output has a deviation of 0.015 lbs. Sample means are given in the table below: Sample # Mean (lbs) 1 2.002 2 2.003 3 1.997 4 2.001 5 1.996 6 1.998 shara a) Suppose that the upper control limit (UCL) for the mean chart has been computed as 2.008 based on the given data. What is the corresponding probability of Type I error (alpha risk)? Is the process in control in this case? b) Suppose that the management desires to reduce their alpha risk (false rejection rate) to 5 percent. Based on this decision, calculate the new upper and lower control limits for the mean chart using the data given above. According to the new control limits, would you reject any sample? Determine also whether the process is in control or not based on the mean chart. Part II: (Range Chart) A canned food manufacturing plant randomly selects 4 cans as a sample each week over a 5- week period in order to determine if the cans have equal weights. The data (in oz.) collected is shown below: 3 21 4 16 15 1 27 25 19 17 25 1 2 3 4 5 2 19 21 16 25 17 WEEK 14 25 17 Based on the data in the above table, construct 3-0 control limits for the range chart and determine whether the process is in control based on the range chart. St Question 6 Part I: (Mean Chart) Six samples have been taken from a machine that is used to fill packages of coffee, where each sample consists of five different observations. It is known from previous experience that the machine's output has a deviation of 0.015 lbs. Sample means are given in the table below: Sample # Mean (lbs) 1 2.002 2 2.003 3 1.997 4 2.001 5 1.996 6 1.998 shara a) Suppose that the upper control limit (UCL) for the mean chart has been computed as 2.008 based on the given data. What is the corresponding probability of Type I error (alpha risk)? Is the process in control in this case? b) Suppose that the management desires to reduce their alpha risk (false rejection rate) to 5 percent. Based on this decision, calculate the new upper and lower control limits for the mean chart using the data given above. According to the new control limits, would you reject any sample? Determine also whether the process is in control or not based on the mean chart. Part II: (Range Chart) A canned food manufacturing plant randomly selects 4 cans as a sample each week over a 5- week period in order to determine if the cans have equal weights. The data (in oz.) collected is shown below: 3 21 4 16 15 1 27 25 19 17 25 1 2 3 4 5 2 19 21 16 25 17 WEEK 14 25 17 Based on the data in the above table, construct 3-0 control limits for the range chart and determine whether the process is in control based on the range chart

Step by Step Solution

There are 3 Steps involved in it

1 Expert Approved Answer
Step: 1 Unlock blur-text-image
Question Has Been Solved by an Expert!

Get step-by-step solutions from verified subject matter experts

Step: 2 Unlock
Step: 3 Unlock

Students Have Also Explored These Related General Management Questions!