

Question: ST104a Live Session Exercise 1 In this exercise you will pract ise aspect s of dat a visualisat ion and descript ive st at ist
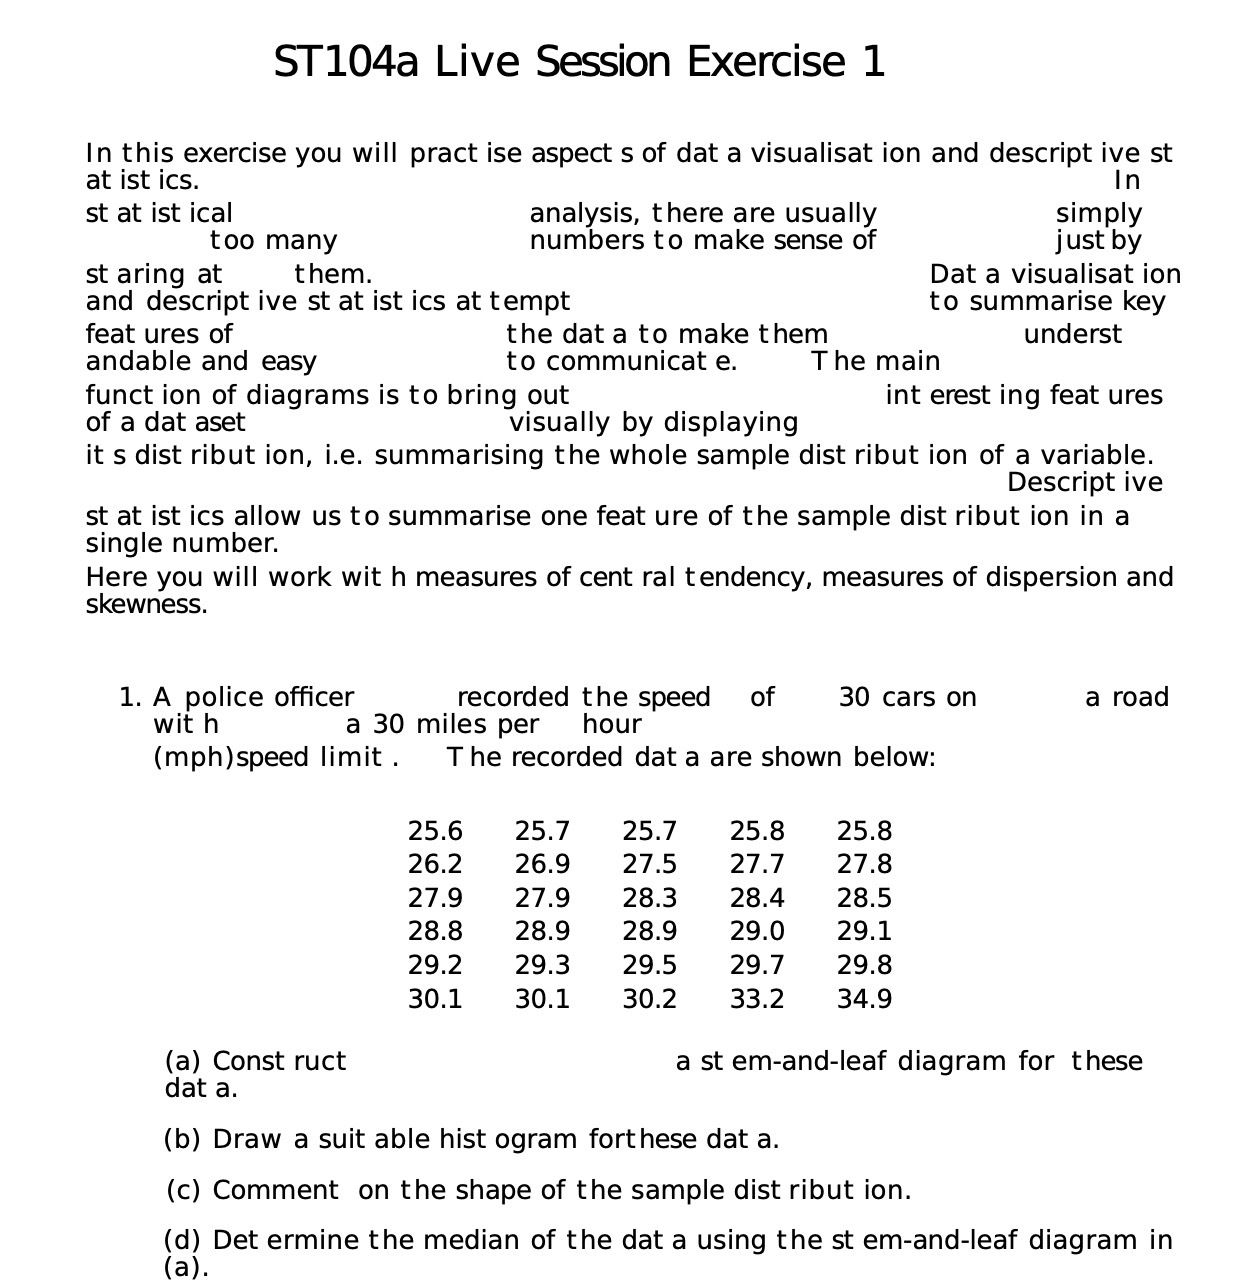

ST104a Live Session Exercise 1 In this exercise you will pract ise aspect s of dat a visualisat ion and descript ive st at ist ics. In stat ist ical analysis, there are usually simply too many numbers to make sense of just by staring at them. Dat a visualisat ion and descript ive stat ist ics at tempt to summarise key feat ures of the dat a to make them underst andable and easy to communicate. The main function of diagrams is to bring out int erest ing feat ures of a dat aset visually by displaying it s dist ribut ion, i.e. summarising the whole sample dist ribut ion of a variable. Descript ive st at ist ics allow us to summarise one feat ure of the sample dist ribut ion in a single number. Here you will work with measures of cent ral tendency, measures of dispersion and skewness. 1. A police officer recorded the speed of 30 cars on a road with a 30 miles per hour (mph) speed limit . The recorded dat a are shown below: 25.6 25.7 25.7 25.8 25.8 26.2 26.9 27.5 27.7 27.8 27.9 27.9 28.3 28.4 28.5 28.8 28.9 28.9 29.0 29.1 29.2 29.3 29.5 29.7 29.8 30.1 30.1 30.2 33.2 34.9 (a) Const ruct a st em-and-leaf diagram for these dat a. (b) Draw a suit able hist ogram forthese dat a. (c) Comment on the shape of the sample dist ribut ion. (d) Det ermine the median of the dat a using the stem-and-leaf diagram in (a)
Step by Step Solution
There are 3 Steps involved in it

Get step-by-step solutions from verified subject matter experts