

Question: STA104 JAN 2018 QUESTION 4 The table below shows the total expenditure on stationaries of 70 students from University A for the recent semester. _-
STA104 JAN 2018
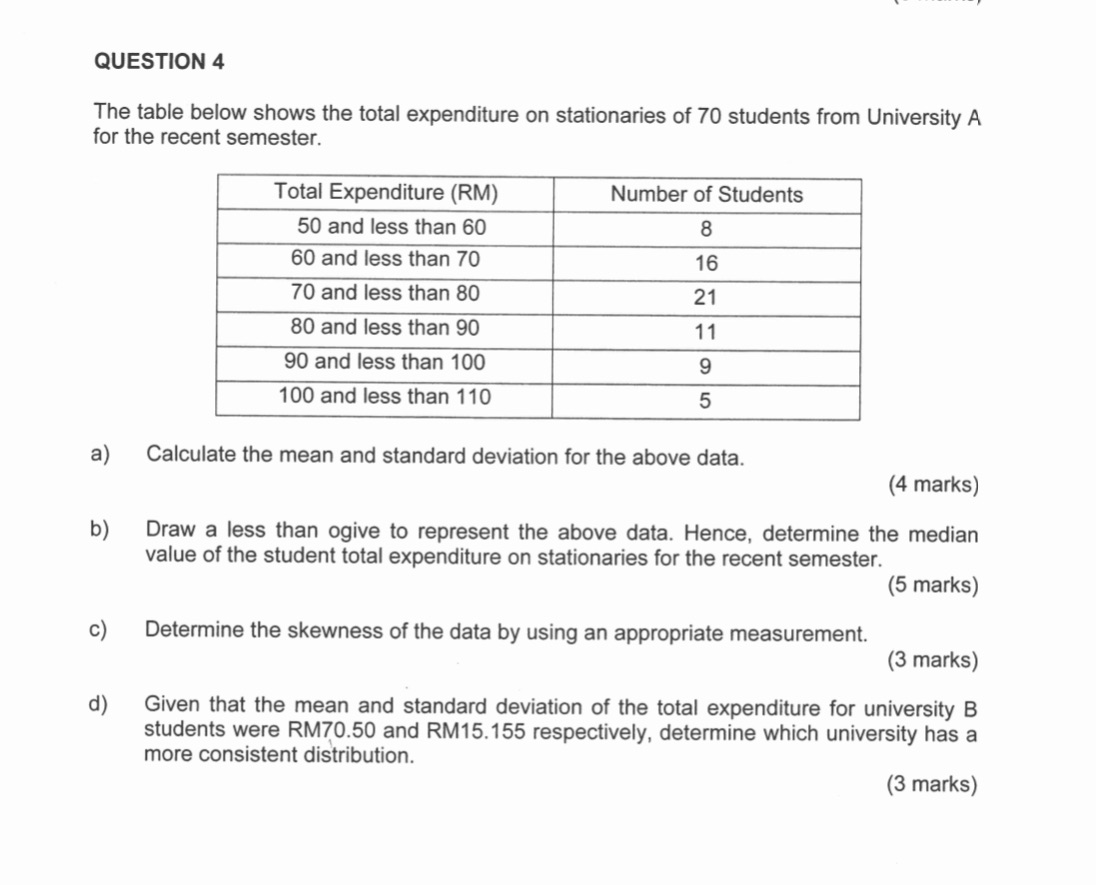
QUESTION 4 The table below shows the total expenditure on stationaries of 70 students from University A for the recent semester. _- __ I- -_ .- 90 and less than 100 100 and less than 110 a) Calculate the mean and standard deviation for the above data. (4 marks) b) Draw a less than ogive to represent the above data. Hence. determine the median value of the student total expenditure on stationaries for the recent semester. (5 marks) 0) Determine the skewness of the data by using an appropriate measurement. (3 marks) 1:!) Given that the mean and standard deviation of the total expenditure for university B students were RMZO.50 and RM15.155 respectively, determine which university has a more consistent distribution
Step by Step Solution
There are 3 Steps involved in it

Get step-by-step solutions from verified subject matter experts