

Question: Standard Normal Table The table below shows the total area under the normal curve for a point that is Z standard deviations to the right
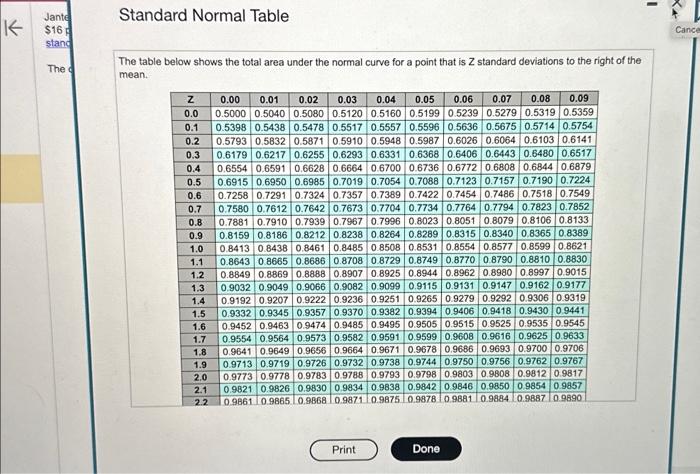
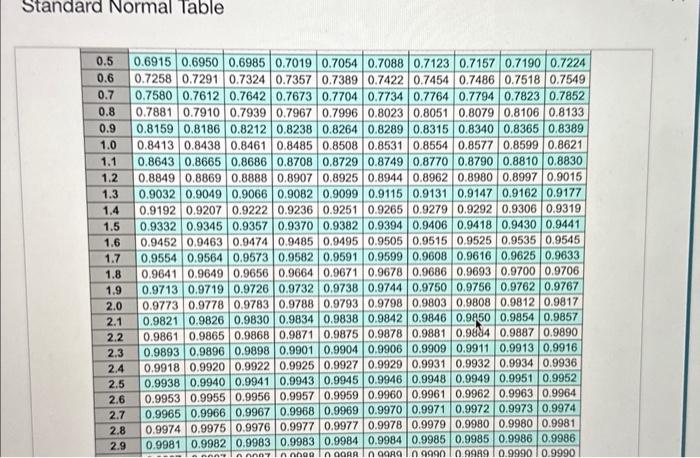
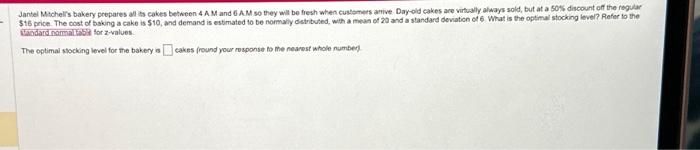
Standard Normal Table The table below shows the total area under the normal curve for a point that is Z standard deviations to the right of the mean. Standard Normal Table Jantel Matchelis bakery prepares al as cakes behween 4AM and 6AM so they will be fresh when customers arive. Day-old cakes are virtualy always sold, but at a Sots discount off the regular 516 price. The cost of baking a cake is 510 , and demand is estimated to be normaliy distrbuted, with a meas of 20 and a standard deviation of 6 What is the optimal stocking level? Refer to the The optimal stocking level for the bakery is cakes (round your rosponse is me nearest whole numbed. Standard Normal Table The table below shows the total area under the normal curve for a point that is Z standard deviations to the right of the mean. Standard Normal Table Jantel Matchelis bakery prepares al as cakes behween 4AM and 6AM so they will be fresh when customers arive. Day-old cakes are virtualy always sold, but at a Sots discount off the regular 516 price. The cost of baking a cake is 510 , and demand is estimated to be normaliy distrbuted, with a meas of 20 and a standard deviation of 6 What is the optimal stocking level? Refer to the The optimal stocking level for the bakery is cakes (round your rosponse is me nearest whole numbed
Step by Step Solution
There are 3 Steps involved in it

Get step-by-step solutions from verified subject matter experts