

Question: Standardize the 10 x-values (TEN DATA x-Values: 1, 31, 45, 43, 50, 42, 34, 53, 50, 98) in the Table below. These z- values are
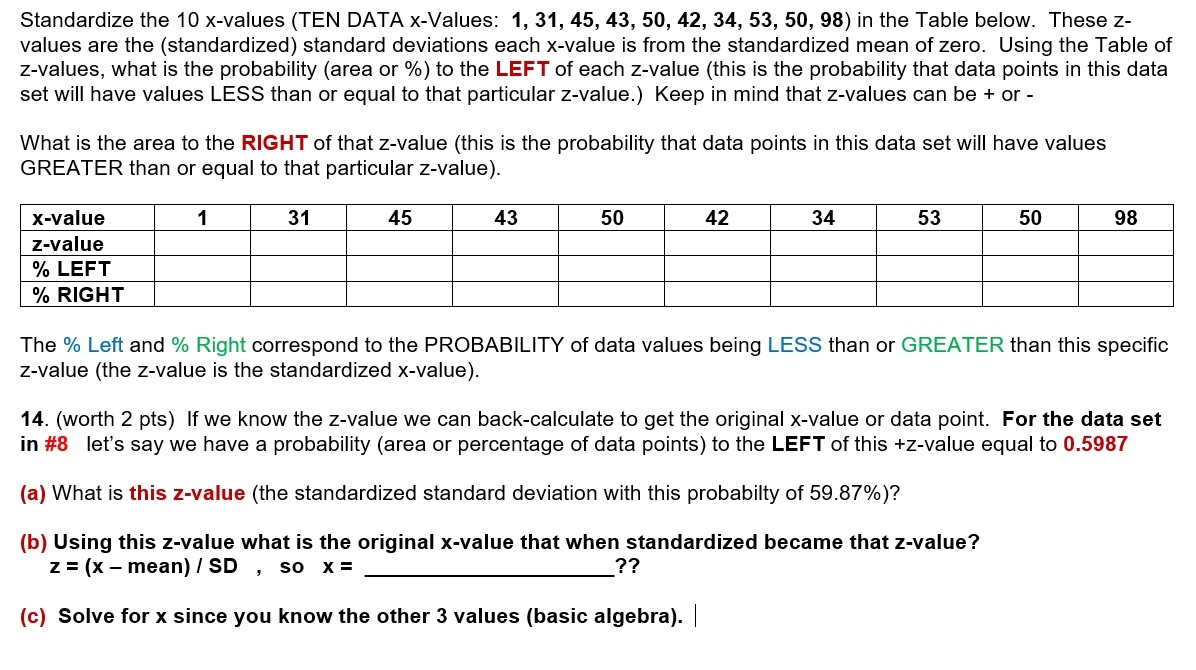
Standardize the 10 x-values (TEN DATA x-Values: 1, 31, 45, 43, 50, 42, 34, 53, 50, 98) in the Table below. These z- values are the (standardized) standard deviations each x-value is from the standardized mean of zero. Using the Table of z-values, what is the probability (area or %) to the LEFT of each z-value (this is the probability that data points in this data set will have values LESS than or equal to that particular z-value.) Keep in mind that z-values can be + or - What is the area to the RIGHT of that z-value (this is the probability that data points in this data set will have values GREATER than or equal to that particular z-value). x-value 1 31 45 43 50 42 34 53 50 98 z-value % LEFT % RIGHT The % Left and % Right correspond to the PROBABILITY of data values being LESS than or GREATER than this specific z-value (the z-value is the standardized x-value). 14. (worth 2 pts) If we know the z-value we can back-calculate to get the original x-value or data point. For the data set in #8 let's say we have a probability (area or percentage of data points) to the LEFT of this +z-value equal to 0.5987 (a) What is this z-value (the standardized standard deviation with this probabilty of 59.87%)? (b) Using this z-value what is the original x-value that when standardized became that z-value? z = (x - mean) / SD , so x = ?? (c) Solve for x since you know the other 3 values (basic algebra). |
Step by Step Solution
There are 3 Steps involved in it

Get step-by-step solutions from verified subject matter experts