

Question: Started: Oct 19 at 1:37pm Quiz Instructions Question 4 1 pts The following Stem & Leaf plot shows the systolic blood pressure of patients participating
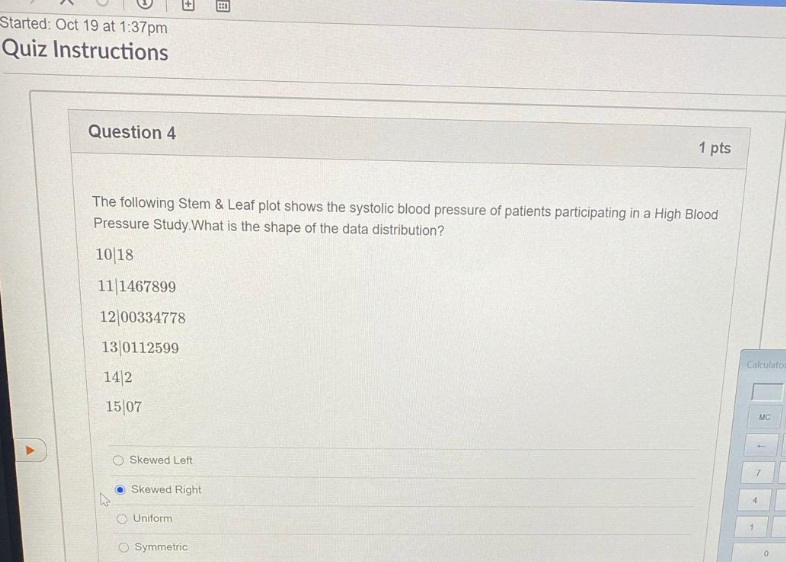
Started: Oct 19 at 1:37pm Quiz Instructions Question 4 1 pts The following Stem & Leaf plot shows the systolic blood pressure of patients participating in a High Blood Pressure Study. What is the shape of the data distribution? 10 18 11 1467899 12 00334778 13 0112599 Calculator 14 2 15 07 MC Skewed Left Skewed Right O Uniform Symmetric
Step by Step Solution
There are 3 Steps involved in it
1 Expert Approved Answer
Step: 1 Unlock

Question Has Been Solved by an Expert!
Get step-by-step solutions from verified subject matter experts
Step: 2 Unlock
Step: 3 Unlock