

Question: Starting in March 2020, there was a negative aggregate demand shock (lockdowns prevented people from buying their usual goods and services) as well as a
Starting in March 2020, there was a negative aggregate demand shock (lockdowns prevented people from buying their usual goods and services) as well as a negative supply shock (production of some essential goods was halted due to COVID outbreaks – or they became more expensive to produce due to supply-chain issues).
Using the IS-MP & Phillips Curve (PC) framework and Okun's Law (OL), which curves shifted in this scenario and how did these shifts affect the output gap, unexpected inflation and unemployment? Explain in words and be sure to use the data on inflation in the plot below to deduce whether the demand or supply shock was larger.
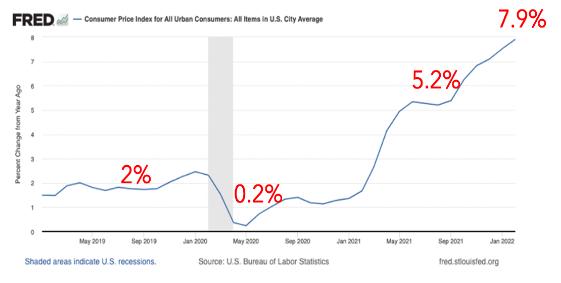
Percent Change from Year Ago FRED Consumer Price Index for All Urban Consumers: All Items in U.S. City Average 2% 0.2% 5.2% 7.9% May 2019 Sep 2019 Jan 2000 May 2000 Sep 2000 Jan 2021 May 2001 Sep 2021 Jan 2002 Shaded areas indicate U.S. recessions. Source: U.S. Bureau of Labor Statistics fredstiouisfed.org
Step by Step Solution
There are 3 Steps involved in it

Get step-by-step solutions from verified subject matter experts