

Question: Starting with the code: clear; close all rng(2000); %random number generator seed mu=[00]; sigma =[41.5;1.52]; r=mvnrnd(mu, sigma, 50); %create two features, 50 samples of each
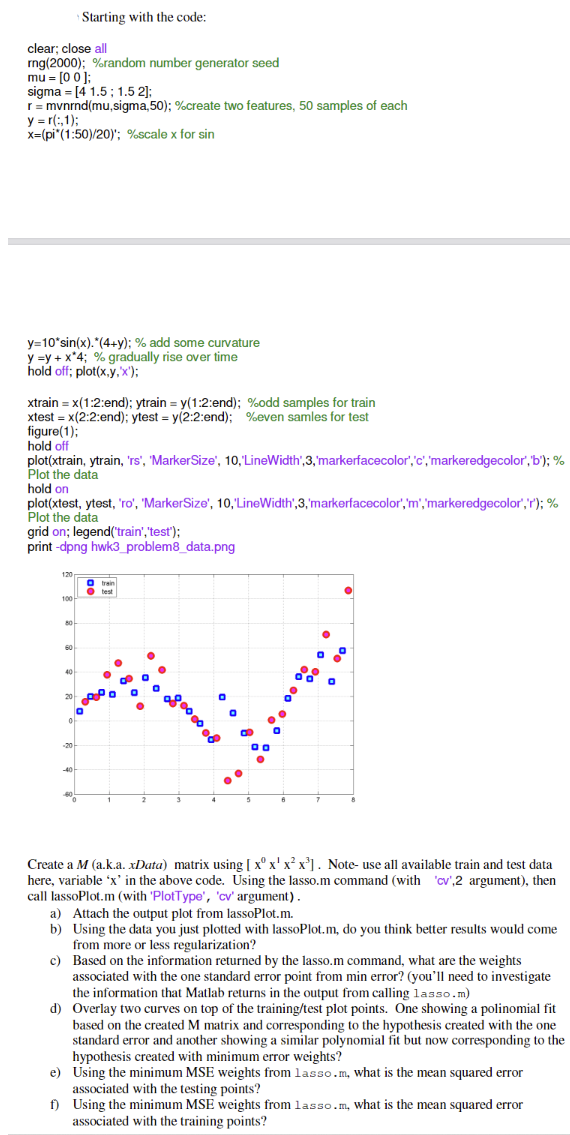
Starting with the code: clear; close all rng(2000); \%random number generator seed mu=[00]; sigma =[41.5;1.52]; r=mvnrnd(mu, sigma, 50); \%create two features, 50 samples of each y=r(:,1); x=(pi(1:50)/20);% scale x for sin y=10sin(x).(4+y);% add some curvature y=y+x4;% gradually rise over time hold off; plot( (x,y,x); x xtrain = x(1:2:end);ytrain=y(1:2: end); % odd samples for train x xtest =x(2:2: end); y ytest =y(2:2: end );% even samles for test figure(1); hold off plot(xtrain, ytrain, 'rs', 'MarkerSize', 10,'LineWidth',3,'markerfacecolor','c','markeredgecolor', 'b'); \% Plot the data hold on plot(xtest, ytest, 'ro', 'MarkerSize', 10,' 'LineWidth',3,'markerfacecolor','m','markeredgecolor','r'); \% Plot the data grid on; legend('train', 'test'); print -dpng hwk3_problem8_data.png Create a M (a.k.a. x Data) matrix using [x0x1x2x3]. Note- use all available train and test data here, variable ' x ' in the above code. Using the lasso.m command (with 'cv',2 argument), then call lassoPlot.m (with 'PlotType', 'cv' argument) . a) Attach the output plot from lassoPlot.m. b) Using the data you just plotted with lassoPlot.m, do you think better results would come from more or less regularization? c) Based on the information returned by the lasso.m command, what are the weights associated with the one standard error point from min error? (you'll need to investigate the information that Matlab returns in the output from calling lasso.m) d) Overlay two curves on top of the training/test plot points. One showing a polinomial fit based on the created M matrix and corresponding to the hypothesis created with the one standard error and another showing a similar polynomial fit but now corresponding to the hypothesis created with minimum error weights? e) Using the minimum MSE weights from lasso.m, what is the mean squared error associated with the testing points? f) Using the minimum MSE weights from 1 asso.m, what is the mean squared error associated with the training points? Starting with the code: clear; close all rng(2000); \%random number generator seed mu=[00]; sigma =[41.5;1.52]; r=mvnrnd(mu, sigma, 50); \%create two features, 50 samples of each y=r(:,1); x=(pi(1:50)/20);% scale x for sin y=10sin(x).(4+y);% add some curvature y=y+x4;% gradually rise over time hold off; plot( (x,y,x); x xtrain = x(1:2:end);ytrain=y(1:2: end); % odd samples for train x xtest =x(2:2: end); y ytest =y(2:2: end );% even samles for test figure(1); hold off plot(xtrain, ytrain, 'rs', 'MarkerSize', 10,'LineWidth',3,'markerfacecolor','c','markeredgecolor', 'b'); \% Plot the data hold on plot(xtest, ytest, 'ro', 'MarkerSize', 10,' 'LineWidth',3,'markerfacecolor','m','markeredgecolor','r'); \% Plot the data grid on; legend('train', 'test'); print -dpng hwk3_problem8_data.png Create a M (a.k.a. x Data) matrix using [x0x1x2x3]. Note- use all available train and test data here, variable ' x ' in the above code. Using the lasso.m command (with 'cv',2 argument), then call lassoPlot.m (with 'PlotType', 'cv' argument) . a) Attach the output plot from lassoPlot.m. b) Using the data you just plotted with lassoPlot.m, do you think better results would come from more or less regularization? c) Based on the information returned by the lasso.m command, what are the weights associated with the one standard error point from min error? (you'll need to investigate the information that Matlab returns in the output from calling lasso.m) d) Overlay two curves on top of the training/test plot points. One showing a polinomial fit based on the created M matrix and corresponding to the hypothesis created with the one standard error and another showing a similar polynomial fit but now corresponding to the hypothesis created with minimum error weights? e) Using the minimum MSE weights from lasso.m, what is the mean squared error associated with the testing points? f) Using the minimum MSE weights from 1 asso.m, what is the mean squared error associated with the training points
Step by Step Solution
There are 3 Steps involved in it

Get step-by-step solutions from verified subject matter experts