

Question: Stat 2 Lab #13: Estimation and confidence intervals Learning objectives: 0 Calculate the expected values and SEs for the sample percentage and sample average 0

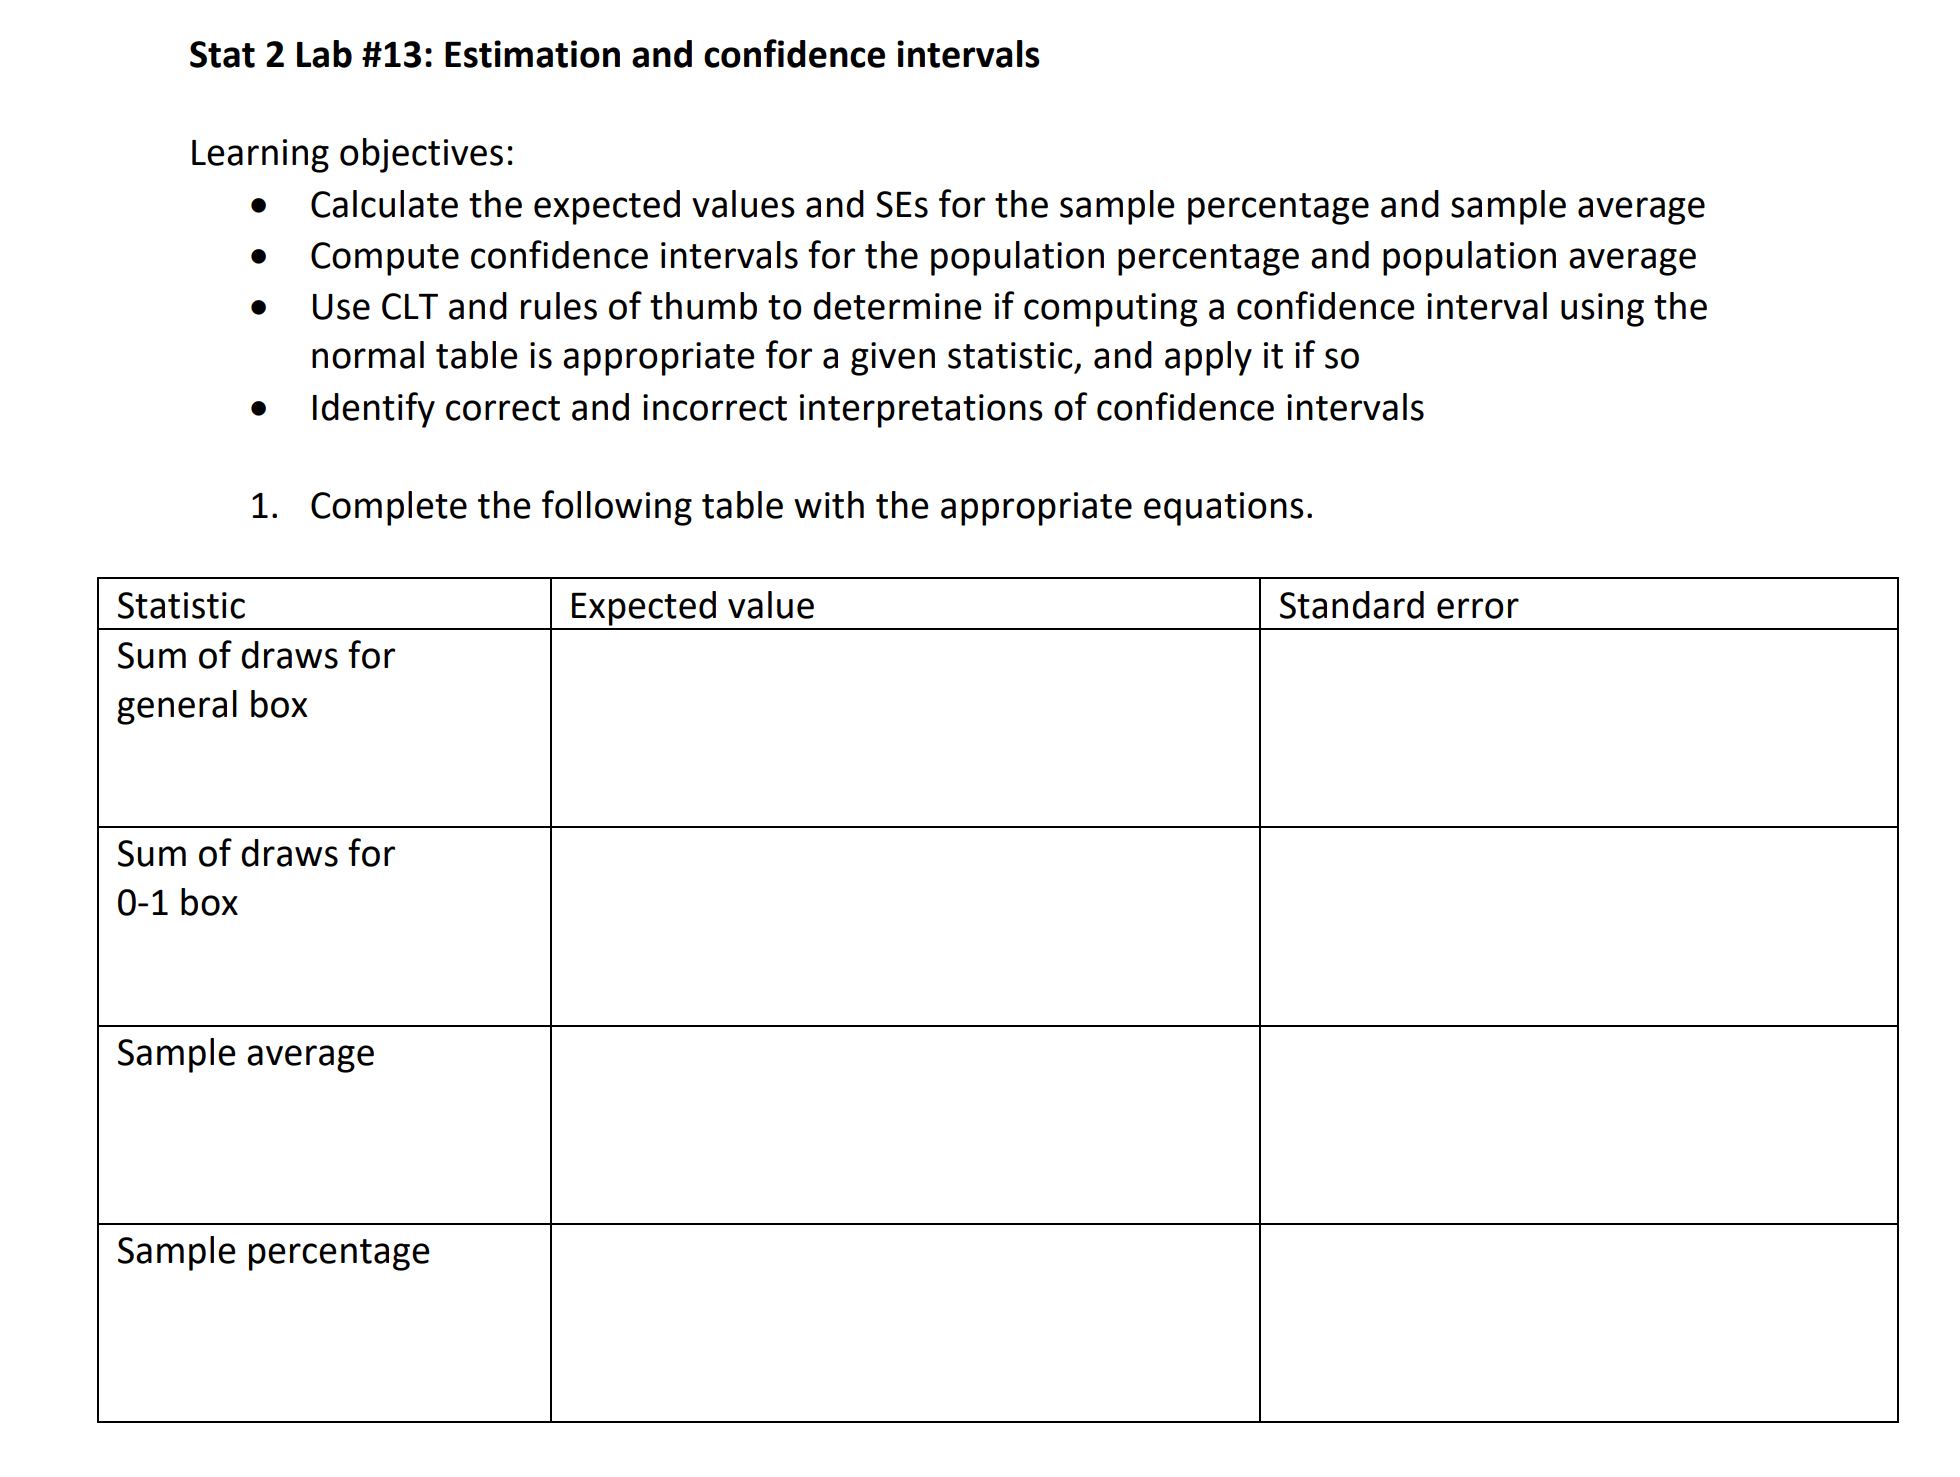
Stat 2 Lab #13: Estimation and confidence intervals Learning objectives: 0 Calculate the expected values and SEs for the sample percentage and sample average 0 Compute confidence intervals for the population percentage and population average 0 Use CLT and rules of thumb to determine if computing a confidence interval using the normal table is appropriate for a given statistic, and apply it if so 0 Identify correct and incorrect interpretations of confidence intervals 1. Complete the following table with the appropriate equations. Statistic Expected value Standard error Sum of draws for general box Sum of draws for 0-1 box Sample average Sample percentage
Step by Step Solution
There are 3 Steps involved in it

Get step-by-step solutions from verified subject matter experts