

Question: STAT 200 Assignment 1 Winter 2020/21 Term 1 For question 1 may be finished by using R Commander to plot graphs and obtain summary statistics
STAT 200 Assignment 1
Winter 2020/21 Term 1
For question 1 may be finished by using R Commander to plot graphs and obtain summary statistics
Please must attach all plots within the question and ensure that all your graphs are labelled appropriately. (i.e. do not put all the graphs at the end of the assignment)
1. The National Basketball Association (NBA) hosts an annual event called the NBA Draft where teams take turns to select players from colleges or international leagues to join their teams. In May, before the draft, a multi-day event called the NBA Draft Combine takes place. Eligible players are interviewed, take medical tests and perform different athletic tests for coaches, managers and scouts. A dataset from the NBA Draft Combine was taken from data.world (https://data.world/) and contains 332 observations collected from 2009 - 2017. The dataset contains variables on the player's name, draft pick number, the year they were drafted, players' height (in inches), wingspan, and max vertical (how high a player can jump, in inches). Suppose you are an analyst working for the NBA and you want to explore the data and answer the questions below. You can find the dataset "nba draft combine all years.csv" on Canvas. (DATA is at the most bottom below)
(a)Construct a histogram to show the distribution of a variable of your choice. Describe the distribution; be sure to comment on the shape, center and spread. Report only one measure of center and one measure of spread that are appropriate for summarizing the data. Any inappropriate statistics provided may result in a deduction of marks. [3 marks]
(b)Create a side-by-side boxplot comparing the distributions of height between different years. Provide a brief interpretation of the graph by comparing the centers and spreads of the distributions. Do you see any trends in the data? [3 marks]
(c)We want to examine the relationship between height and the following variables: i. Draft pick
ii.Wingspan
iii.Vertical max
Write a few sentences briefly comparing the three relationships. Comment on the pattern and strength of each relationship. Provide appropriate statistics and plots to support your answer. [6 marks]
(d)Is a least squares regression appropriate for the relationship between draft pick and height? If no, justify your answer. If yes, do the following: [2 marks]
i.Fit a least square regression line in R using height as the explanatory variable. Write down the equation of the regression line.
ii.Draw the appropriate plot(s) to assess the adequacy of the linear fit in part (1(d)i). Comment on the adequecy of the fit and justify your answer.
(e)Is a least squares regression appropriate for the relationship between wingspan and height? If no, justify your answer. If yes, do the following: [2 marks]
i.Fit a least square regression line in R using height as the explanatory variable. Write down the equation of the regression line.
ii.Draw the appropriate plot(s) to assess the adequacy of the linear fit in part (1(e)i). Comment on the adequecy of the fit and justify your answer.
(f)We want to know if there is a linear relationship between vertical max and height.
i.Fit a least squares regression line in R to predict vertical max from height. Write down the equation of the regression line. [2 marks]
ii.Draw the appropriate plot(s) to assess the adequacy of the linear fit in part (1(f)i). Is the fit adequate? Justify your answer. [2 marks]
iii.Provide an interpretation of the intercept and slope of your regression line in the context of the question. [2 marks]
iv.Use the fitted regression line to predict the vertical max for a player who is 80 inches tall. Use the fitted regression line to predict the vertical max for a player who is 100 inches tall. Do you see any issues with either of your calculations? Briefly explain why or why not. [3 marks]
2.Managers at the StatLand Golf Course received complaints about the conditions of their greens. Players at the golf course complained that the greens were too fast. The "green speed" is a rating that represents how fast golf balls roll on a putting surface, and therefore how hard a player has to putt the ball to reach the hole. Management decided to conduct a survey of 100 junior and 100 adult golfers. They asked players their opinion of the greens conditions and looked at their "golf handicap", which is a numerical measure of a golfer's potential. A lower handicap score is considered better. The survey results are summarized below.
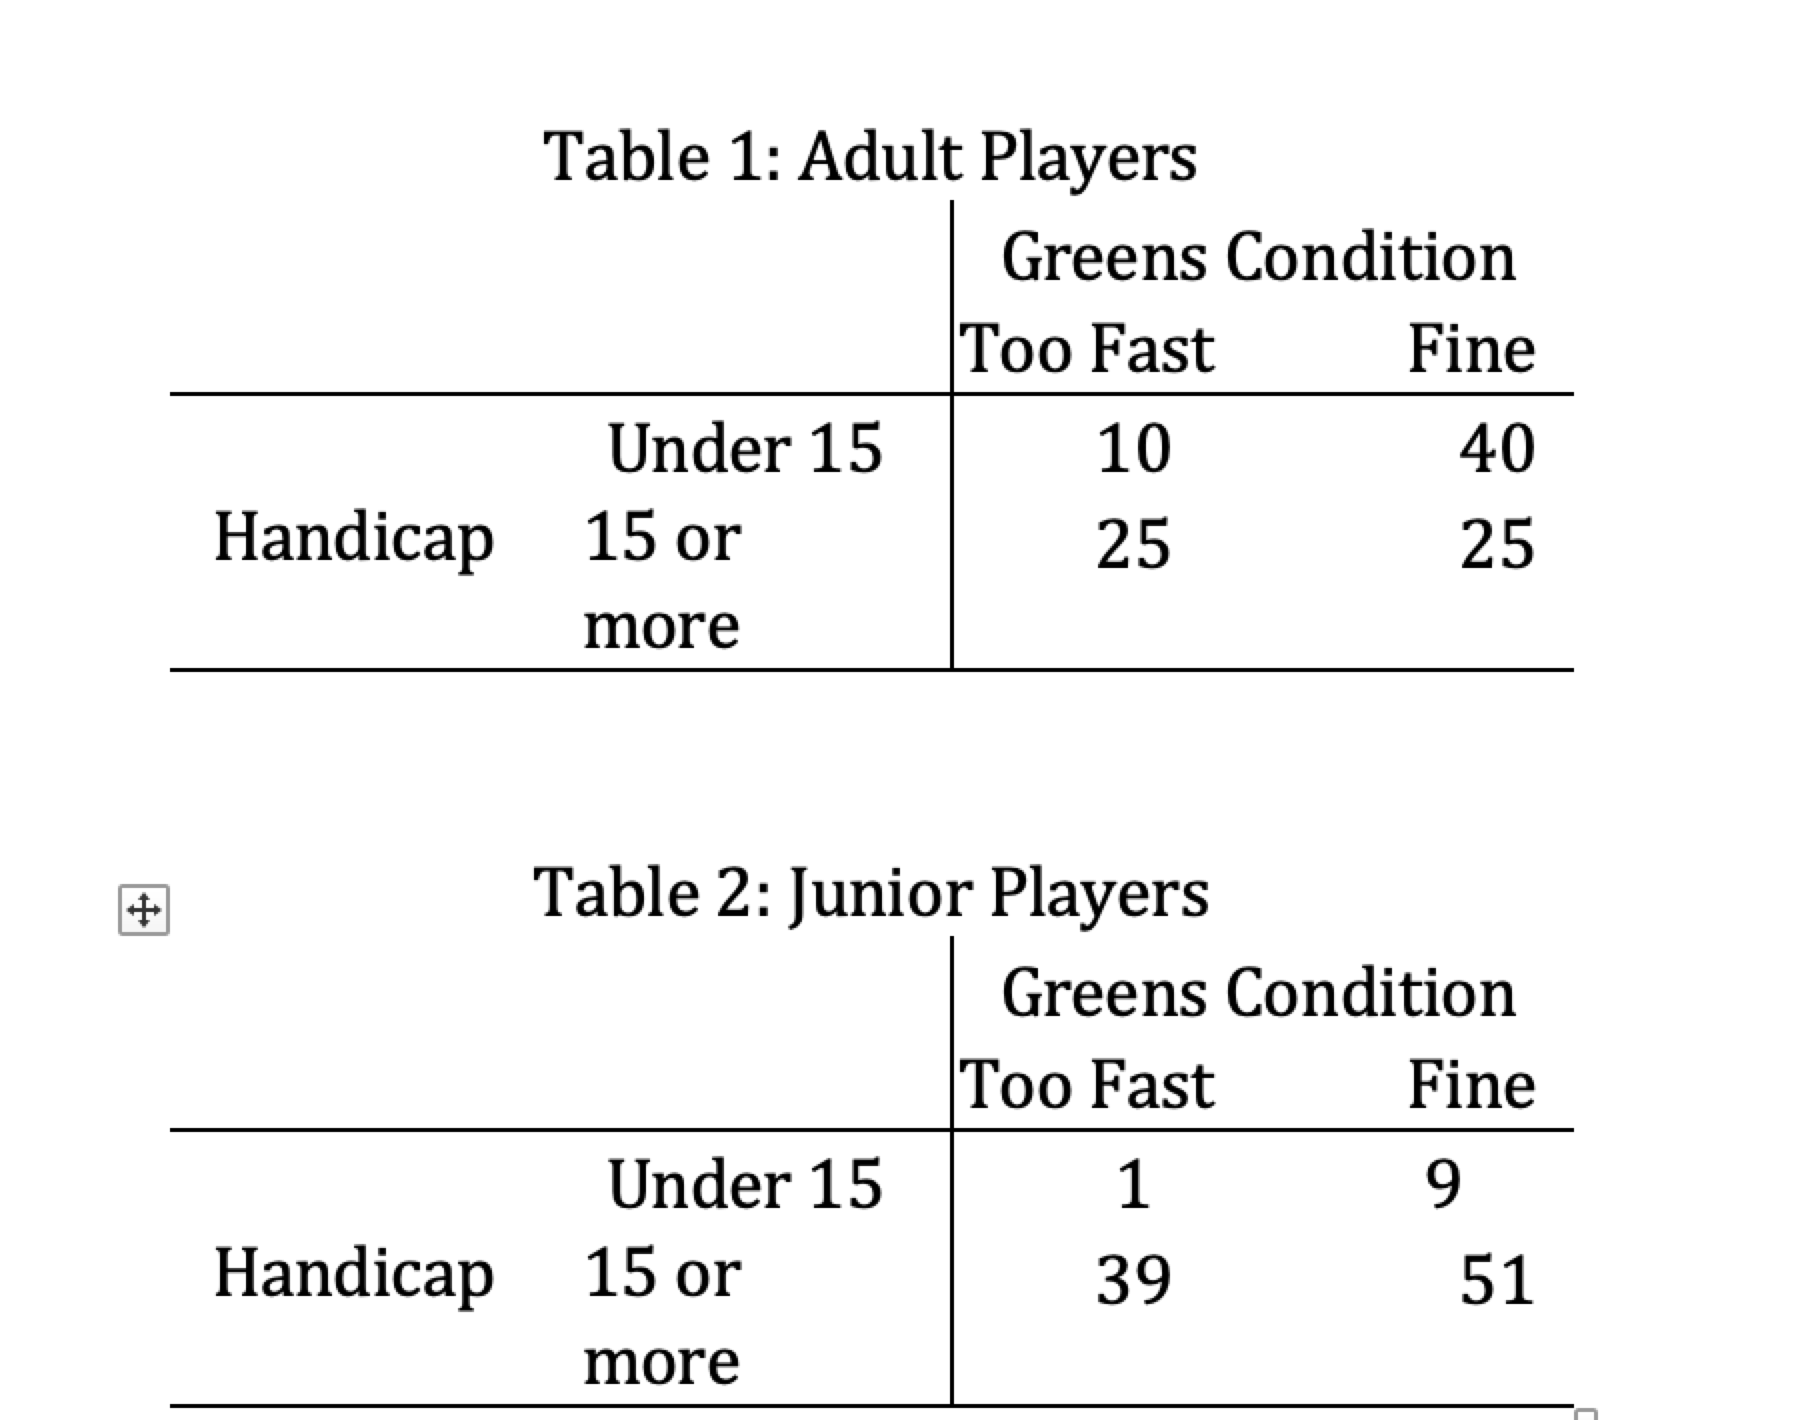
Table 1: Adult Players Greens Condition Too Fast Fine Under 15 10 4O Handicap 15 or 25 25 more Table 2: Junior Players Greens Condition Too Fast Fine Under 15 1 9 Handicap 15 or 39 51 more
Step by Step Solution
There are 3 Steps involved in it

Get step-by-step solutions from verified subject matter experts