

Question: STAT 3 1 9 Lab 2 ( Manually and EXCEL ) MATH 1 0 1 , MATH 1 0 2 and ENG 1 0 1
STAT LabManually and EXCEL
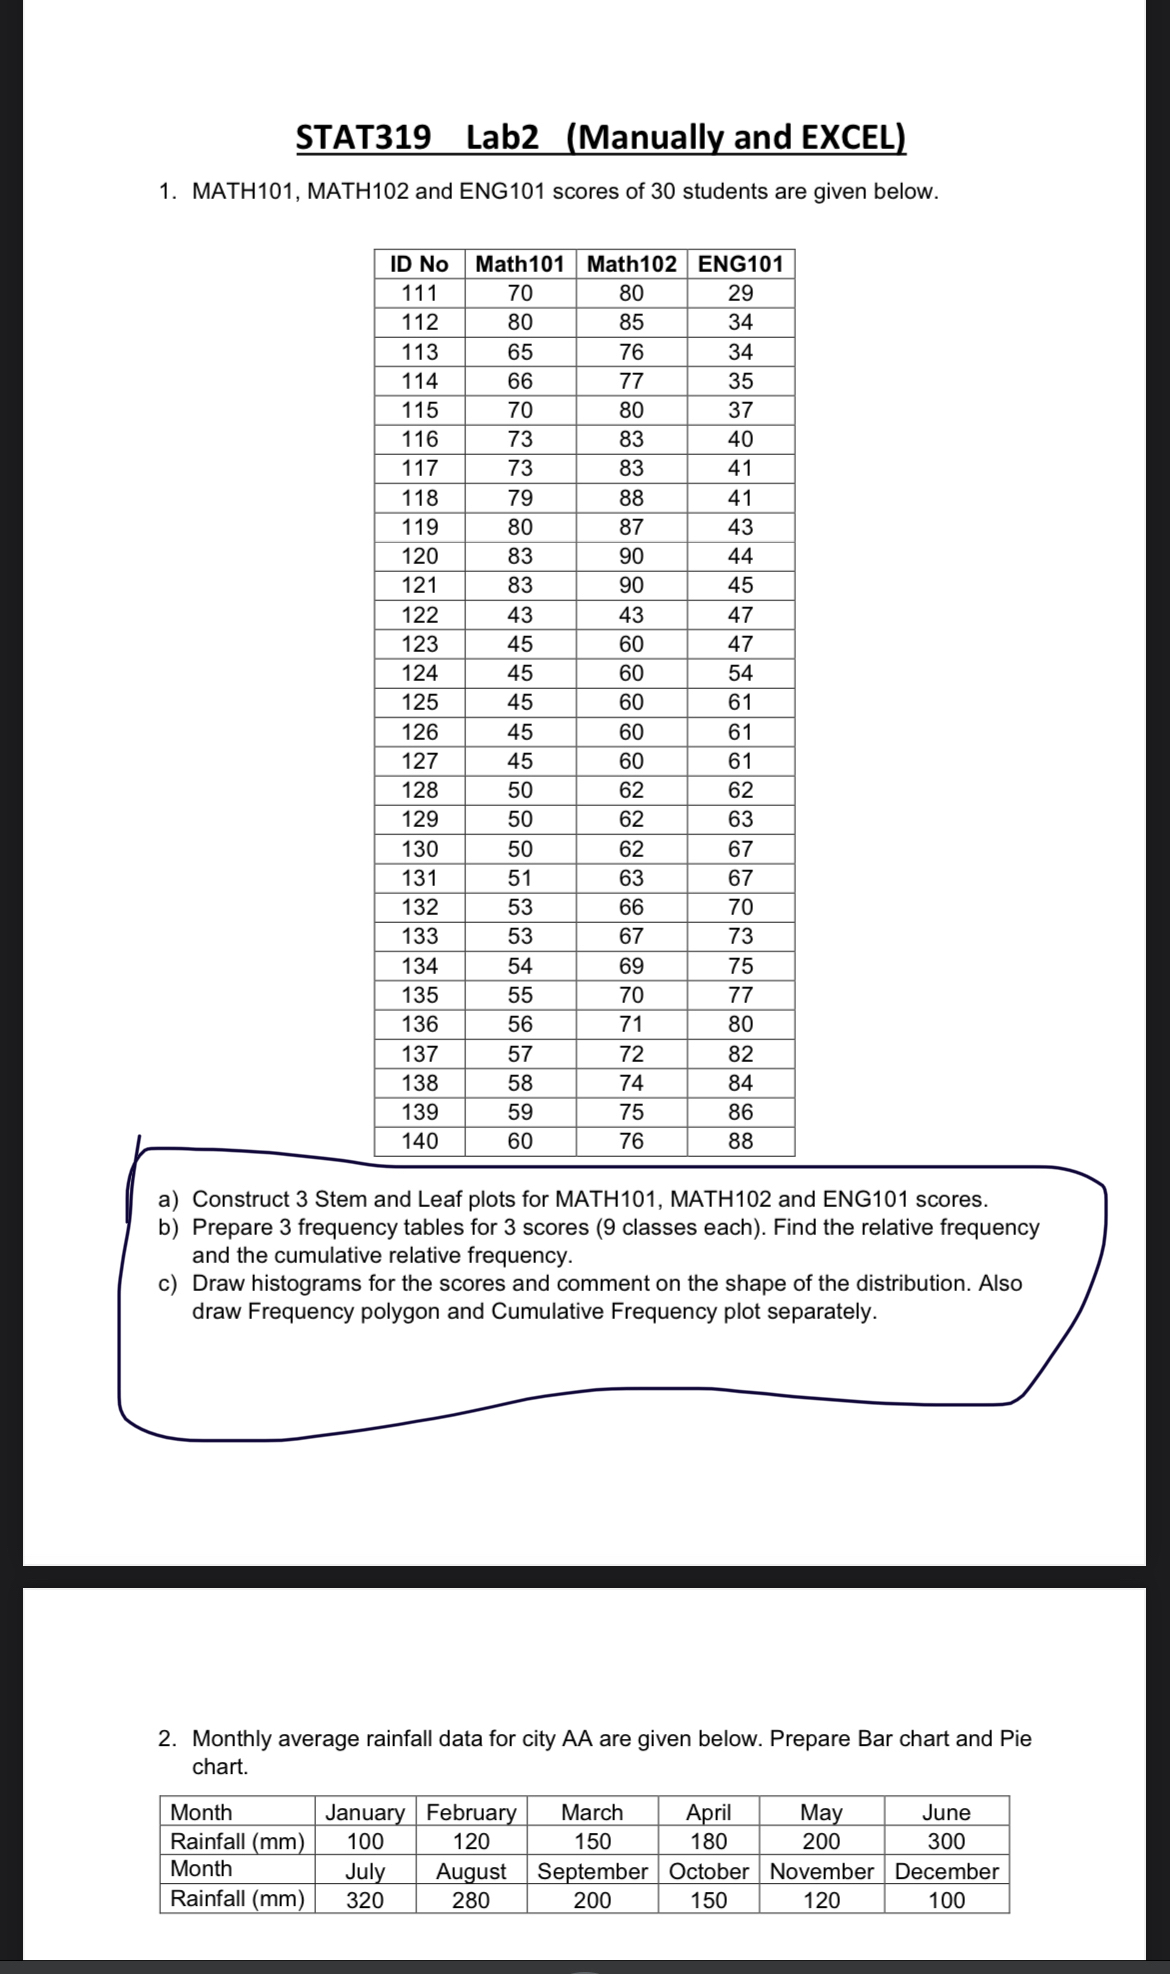
MATH MATH and ENG scores of students are given below.
tableID NoMathMathENG
a Construct Stem and Leaf plots for MATH MATH and ENG scores.
b Prepare frequency tables for scores classes each Find the relative frequency and the cumulative relative frequency.
c Draw histograms for the scores and comment on the shape of the distribution. Also draw Frequency polygon and Cumulative Frequency plot separately.
Monthly average rainfall data for city AA are given below. Prepare Bar chart and Pie chart.
tableMonthJanuary,February,March,April,May,JuneRainfall MonthJuly,August,September,October,November,DecemberRainfall
Step by Step Solution
There are 3 Steps involved in it
1 Expert Approved Answer
Step: 1 Unlock

Question Has Been Solved by an Expert!
Get step-by-step solutions from verified subject matter experts
Step: 2 Unlock
Step: 3 Unlock