

Question: STAT. Chapter 12 10. The number of a certain type of bacteria present (in thousands) after a certain number of hours is given in the
STAT. Chapter 12
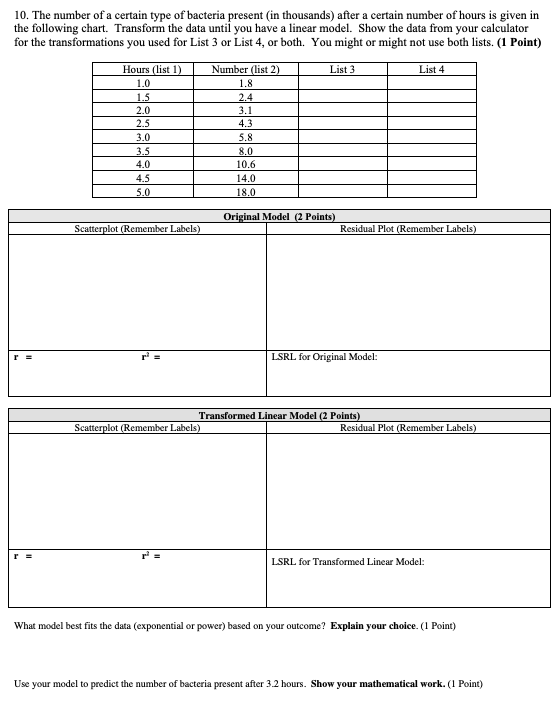
10. The number of a certain type of bacteria present (in thousands) after a certain number of hours is given in the following chart. Transform the data until you have a linear model. Show the data from your calculator for the transformations you used for List 3 or List 4, or both. You might or might not use both lists. (1 Point) Hours (list 1) Number (list 2) List 3 List 4 1.0 1.8 1.5 2.4 2.0 3.1 2.5 4.3 3.0 5.8 3.5 8.0 4.0 10.6 4.5 14.0 5.0 18.0 Original Model (2 Points) Scatterplot (Remember Labels) Residual Plot (Remember Labels P : r = LSRL for Original Model: Transformed Linear Model (2 Points) Scatterplot (Remember Labels) Residual Plot (Remember Labels) LSRL for Transformed Linear Model: What model best fits the data (exponential or power) based on your outcome? Explain your choice. (1 Point) Use your model to predict the number of bacteria present after 3.2 hours. Show your mathematical work. (1 Point)
Step by Step Solution
There are 3 Steps involved in it

Get step-by-step solutions from verified subject matter experts