

Question: Stata output for Assignment 2, Problems 2 and 3 2. summarize educ, detail Table 1 Resp. Highest Year of School Completed Percentiles Smallest 1% 5
Stata output for Assignment 2, Problems 2 and 3
2.
summarize educ, detail
Table 1 Resp. Highest Year of School Completed
| Percentiles | Smallest | |||
| 1% | 5 | 0 | ||
| 5% | 8 | 0 | ||
| 10% | 10 | 0 | Obs | 2985 |
| 25% | 12 | 0 | Sum of Wgt. | 2985 |
| 50% | 13 | Mean | 13.15779 | |
| Largest | Std. Dev. | 2.971078 | ||
| 75% | 16 | 20 | ||
| 90% | 17 | 20 | Variance | 8.827306 |
| 95% | 18 | 20 | Skewness | -.2573837 |
| 99% | 20 | 20 | Kurtosis | 3.91072 |
Summarize paeduc, detail
Table 2 Fathers highest year of school completed
| Percentiles | Smallest | |||
| 1% | 0 | 0 | ||
| 5% | 3 | 0 | ||
| 10% | 6 | 0 | Obs | 2155 |
| 25% | 8 | 0 | Sum of Wgt. | 2155 |
| 50% | 12 | Mean | 11.06682 | |
| Largest | Std. Dev. | 4.201758 | ||
| 75% | 14 | 20 | ||
| 90% | 16 | 20 | Variance | 17;65477 |
| 95% | 18 | 20 | Skewness | -.2543739 |
| 99% | 20 | 20 | Kurtosis | 3.042994 |
3.
tab paeduc_o educ_o
| Fathers highest year of school categories | Rep. highest year of school categories | ||||
| HS | Some Coll | College | Total | ||
| 208 | 353 | 188 | 151 | 900 | |
| HS | 44 | 227 | 203 | 163 | 637 |
| Some Coll | 12 | 45 | 97 | 86 | 240 |
| College | 6 | 43 | 91 | 237 | 377 |
| Total | 270 | 668 | 579 | 637 | 2154 |
tab paeduc_o educ_o, row
Key
Frequency
Row percentage
| Fathers highest year of school categories | Rep. highest year of school categories | ||||
| HS | Some Coll | College | Total | ||
208 23.11 | 353 39.22 | 188 20.89 | 151 16.78 | 900 100.00 | |
| HS | 44 6.91 | 227 35.64 | 203 31.87 | 163 25.59 | 637 100.00 |
| Some Coll | 12 5.00 | 45 18.75 | 97 40.42 | 86 35.83 | 240 100.00 |
| College | 6 1.59 | 43 11.41 | 91 24.14 | 237 62.86 | 377 100.00 |
| Total | 270 12.53 | 668 31.01 | 579 26.88 | 637 29.57 | 2154 100.00 |
tab paeduc_o educ_o, col
Key
Frequency
Column percentage
| Fathers highest year of school categories | Rep. highest year of school categories | ||||
| HS | Some Coll | College | Total | ||
208 77.04 | 353 52.84 | 188 32.47 | 151 23.70 | 900 41.78 | |
| HS | 44 16.30 | 227 33.98 | 203 35.06 | 163 25.59 | 637 29.57 |
| Some Coll | 12 4.44 | 45 6.74 | 97 16.75 | 86 13.50 | 240 11.14 |
| College | 6 2.22 | 43 6.44 | 91 15.72 | 237 37.21 | 377 17.50 |
| Total | 270 100.00 | 668 100.00 | 579 100.00 | 637 100.00 | 2154 100.00 |
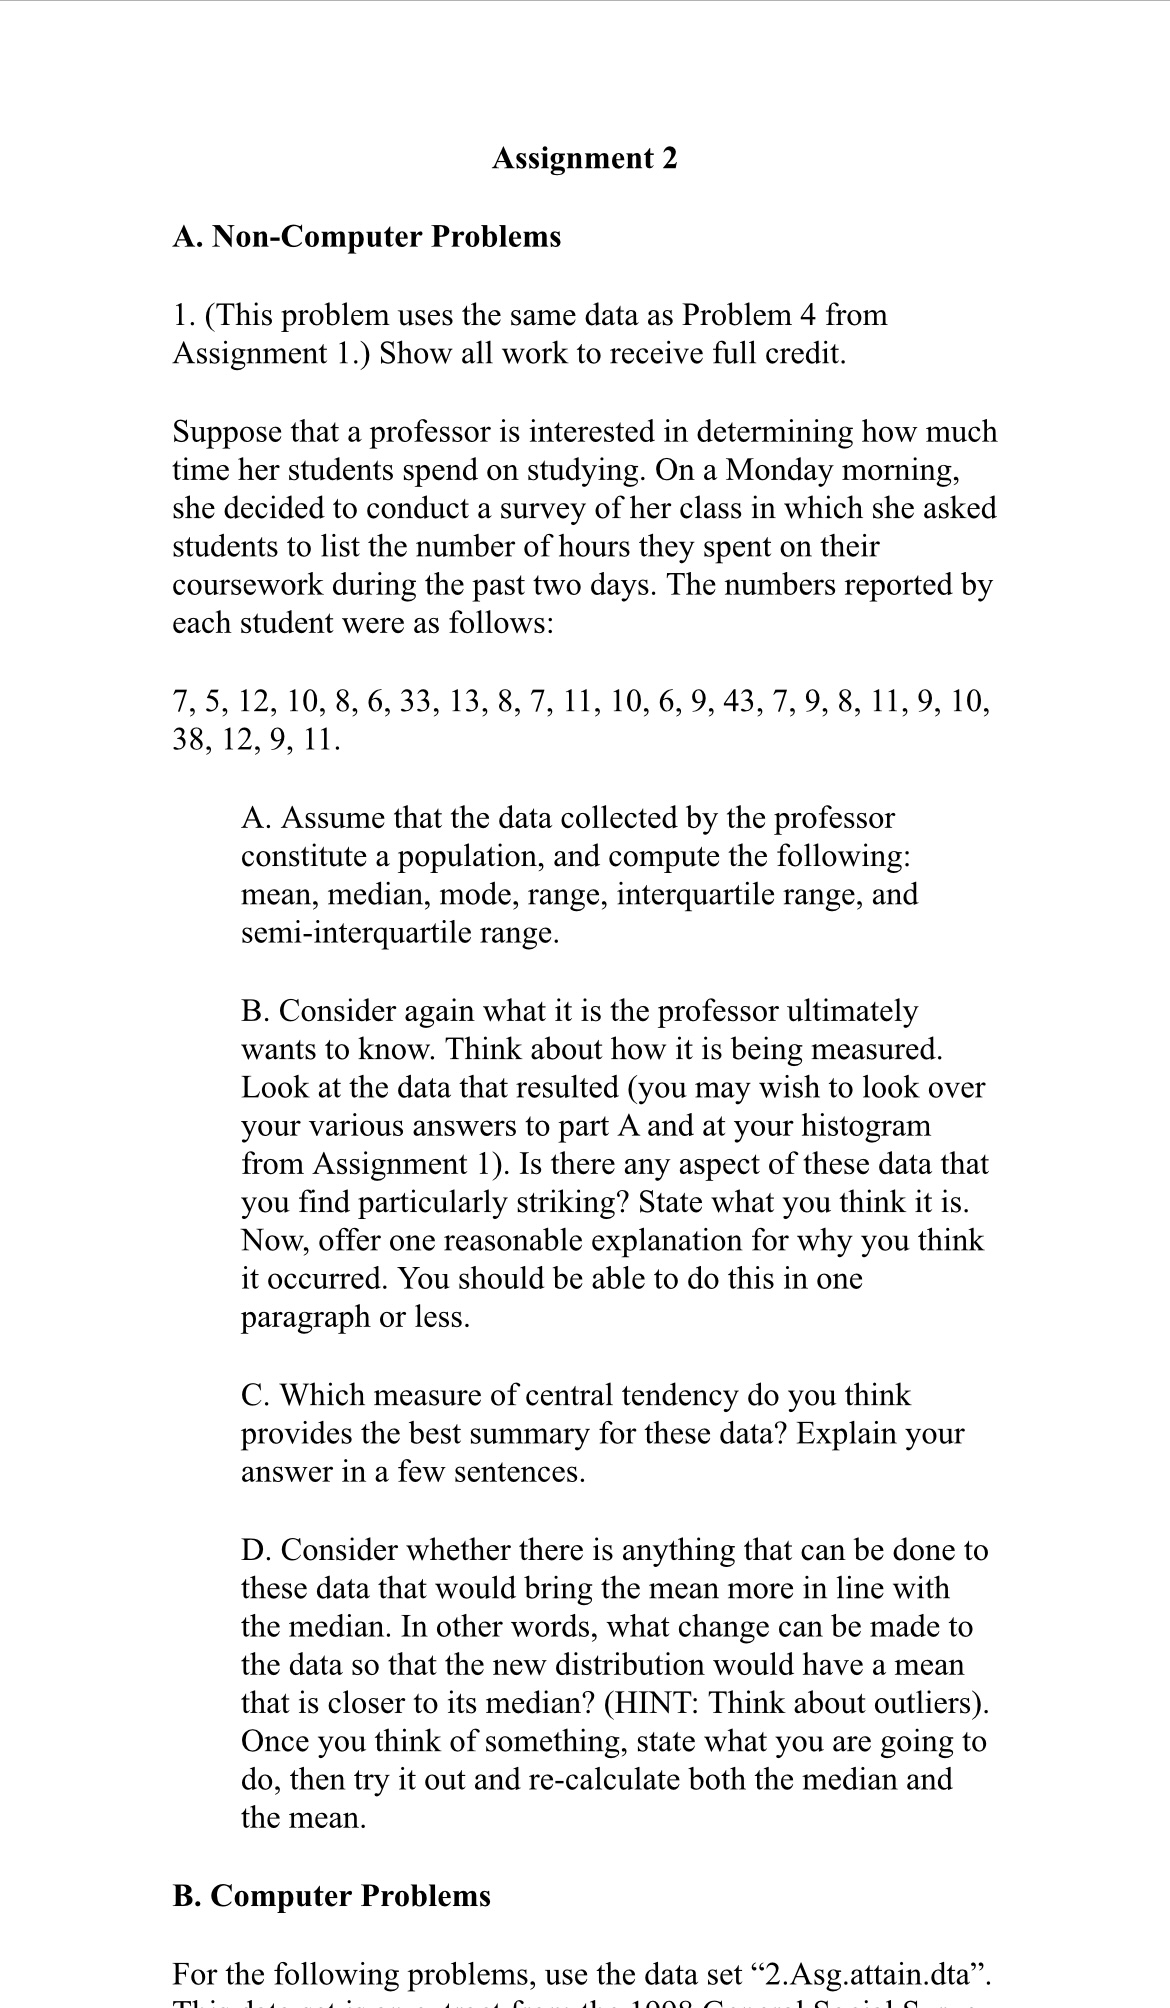
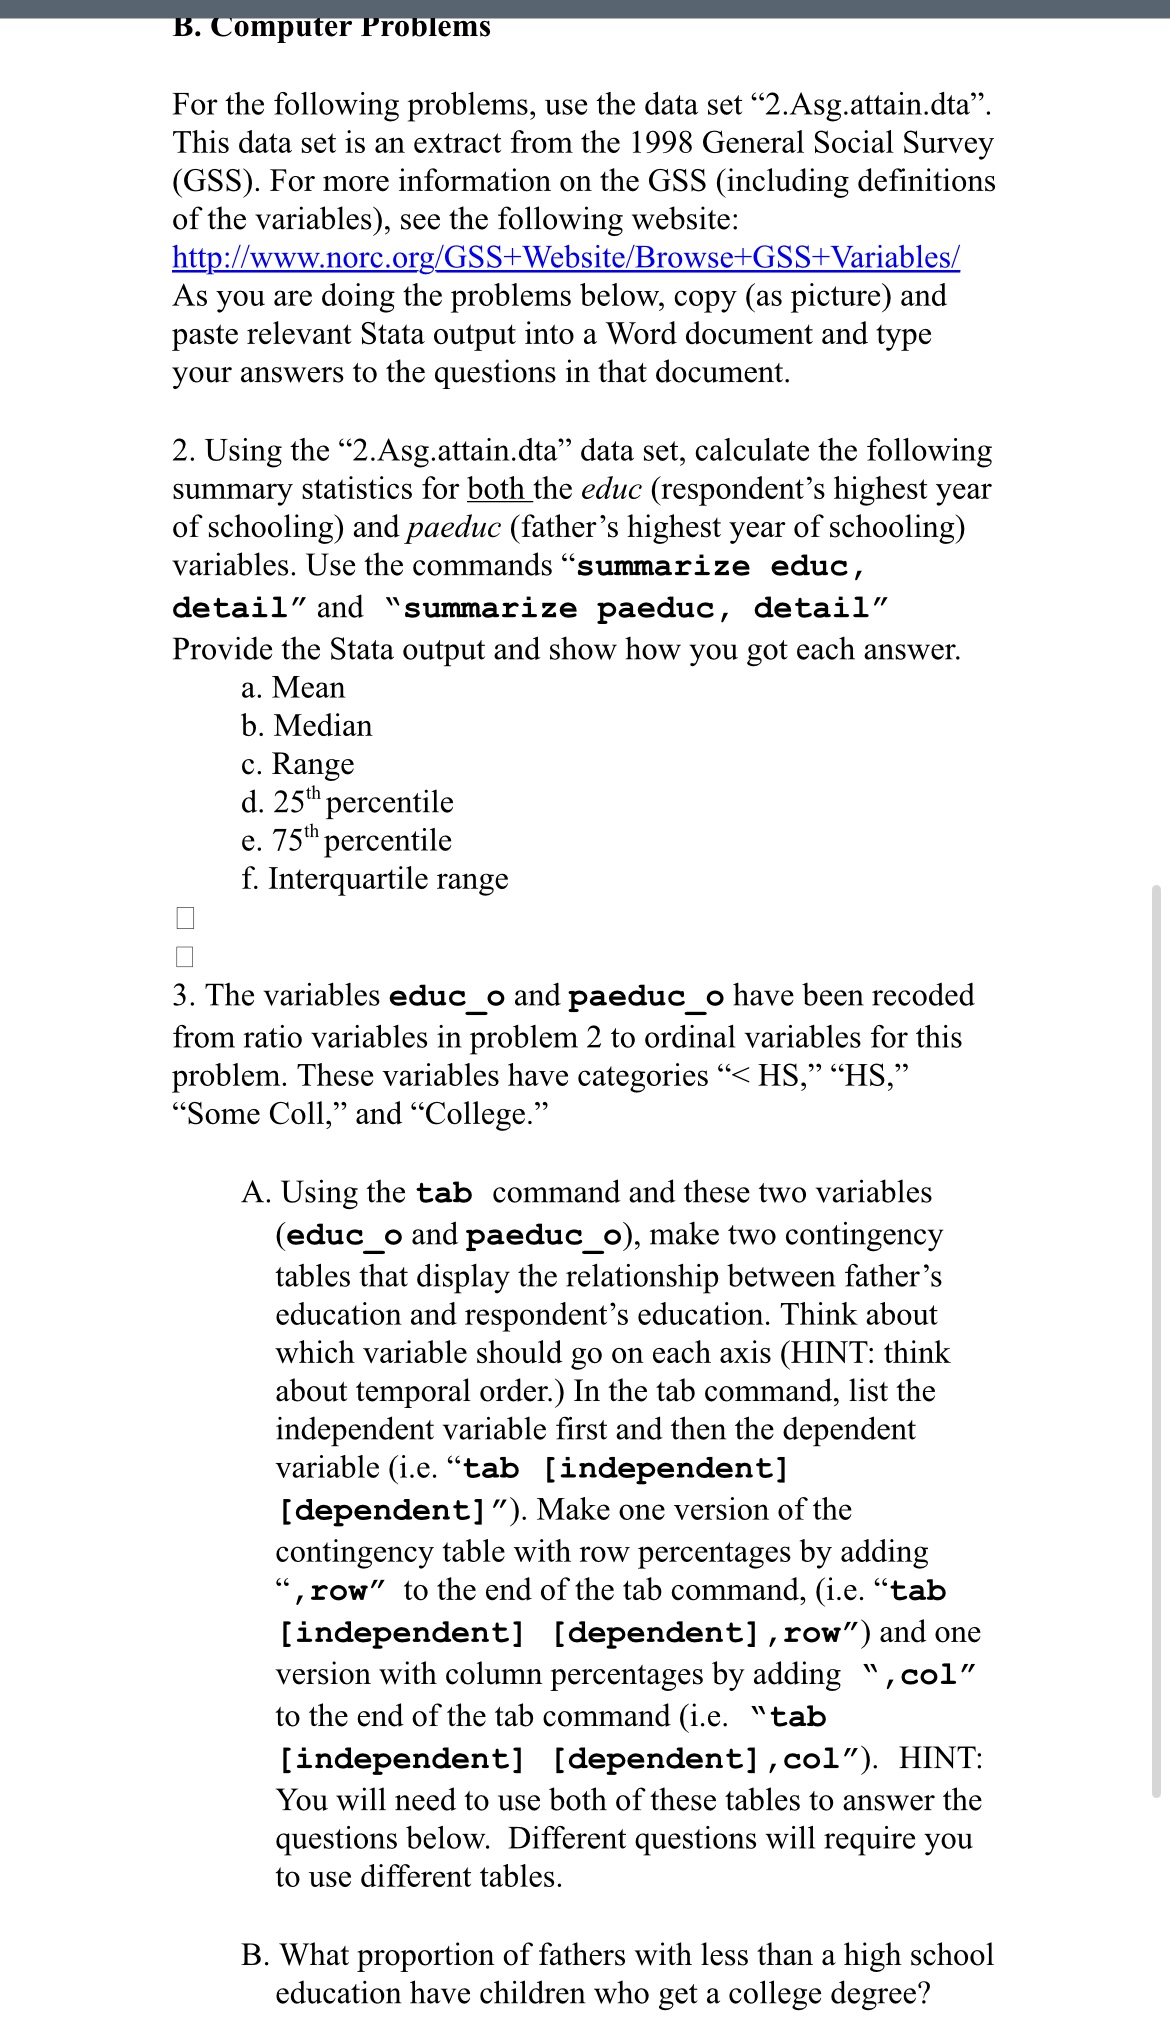
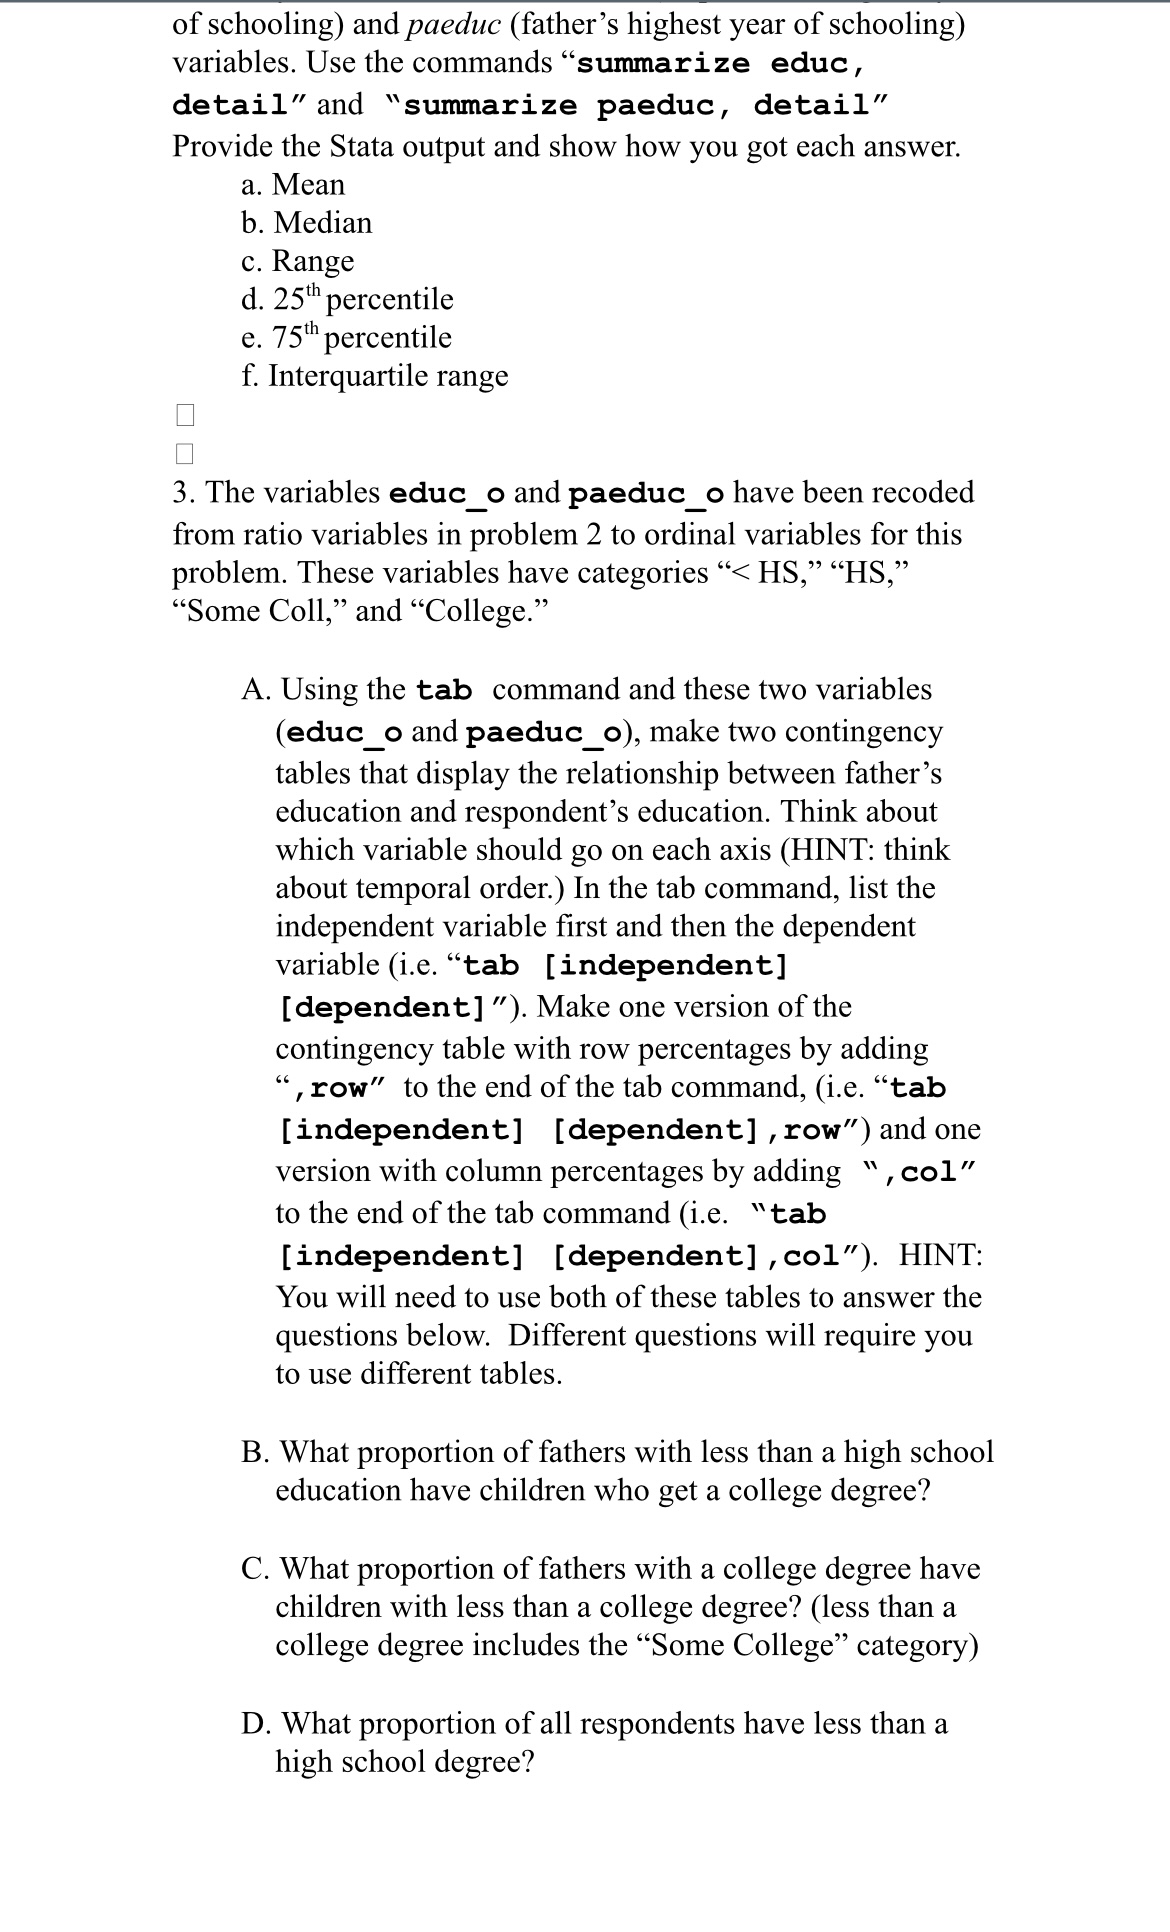
Assignment 2 A. Non-Computer Problems 1. (This problem uses the same data as Problem 4 from Assignment 1.) Show all work to receive full credit. Suppose that a professor is interested in determining how much time her students spend on studying. On a Monday morning, she decided to conduct a survey of her class in which she asked students to list the number of hours they spent on their coursework during the past two days. The numbers reported by each student were as follows: 75,12, 10, 8, 6, 33, 13, 8, 7,11, 10,6,9,43,7,9, 8, 11,9, 10, 38,12,9,11. A. Assume that the data collected by the professor constitute a population, and compute the following: mean, median, mode, range, interquartile range, and semi-interquartile range. B. Consider again what it is the professor ultimately wants to know. Think about how it is being measured. Look at the data that resulted (you may wish to look over your various answers to part A and at your histogram from Assignment 1). Is there any aspect of these data that you find particularly striking? State what you think it is. Now, offer one reasonable explanation for why you think it occurred. You should be able to do this in one paragraph or less. C. Which measure of central tendency do you think provides the best summary for these data? Explain your answer in a few sentences. D. Consider whether there is anything that can be done to these data that would bring the mean more in line with the median. In other words, what change can be made to the data so that the new distribution would have a mean that is closer to its median? (HINT: Think about outliers). Once you think of something, state what you are going to do, then try it out and re-calculate both the median and the mean. B. Computer Problems For the following problems, use the data set \"2.Asg.attain.dta\". o 1 1 1TNnNO 10 .1 . Eompu!er !ro\"lems For the following problems, use the data set \"2. Asg.attain.dta\". This data set is an extract from the 1998 General Social Survey (GSS). For more information on the GSS (including definitions of the variables), see the following website: http://www.nore.org/GSS+Website/Browse+GSS+Variables/ As you are doing the problems below, copy (as picture) and paste relevant Stata output into a Word document and type your answers to the questions in that document. 2. Using the \"2.Asg.attain.dta\" data set, calculate the following summary statistics for both the educ (respondent's highest year of schooling) and paeduc (father's highest year of schooling) variables. Use the commands \"summarize educ, detail\" and \"summarize paeduc, detail\" Provide the Stata output and show how you got each answer. a. Mean b. Median c. Range d. 25" percentile e. 75" percentile f. Interquartile range d 3. The variables educ_o and paeduc_o have been recoded from ratio variables in problem 2 to ordinal variables for this problem. These variables have categories \"
Step by Step Solution
There are 3 Steps involved in it

Get step-by-step solutions from verified subject matter experts