

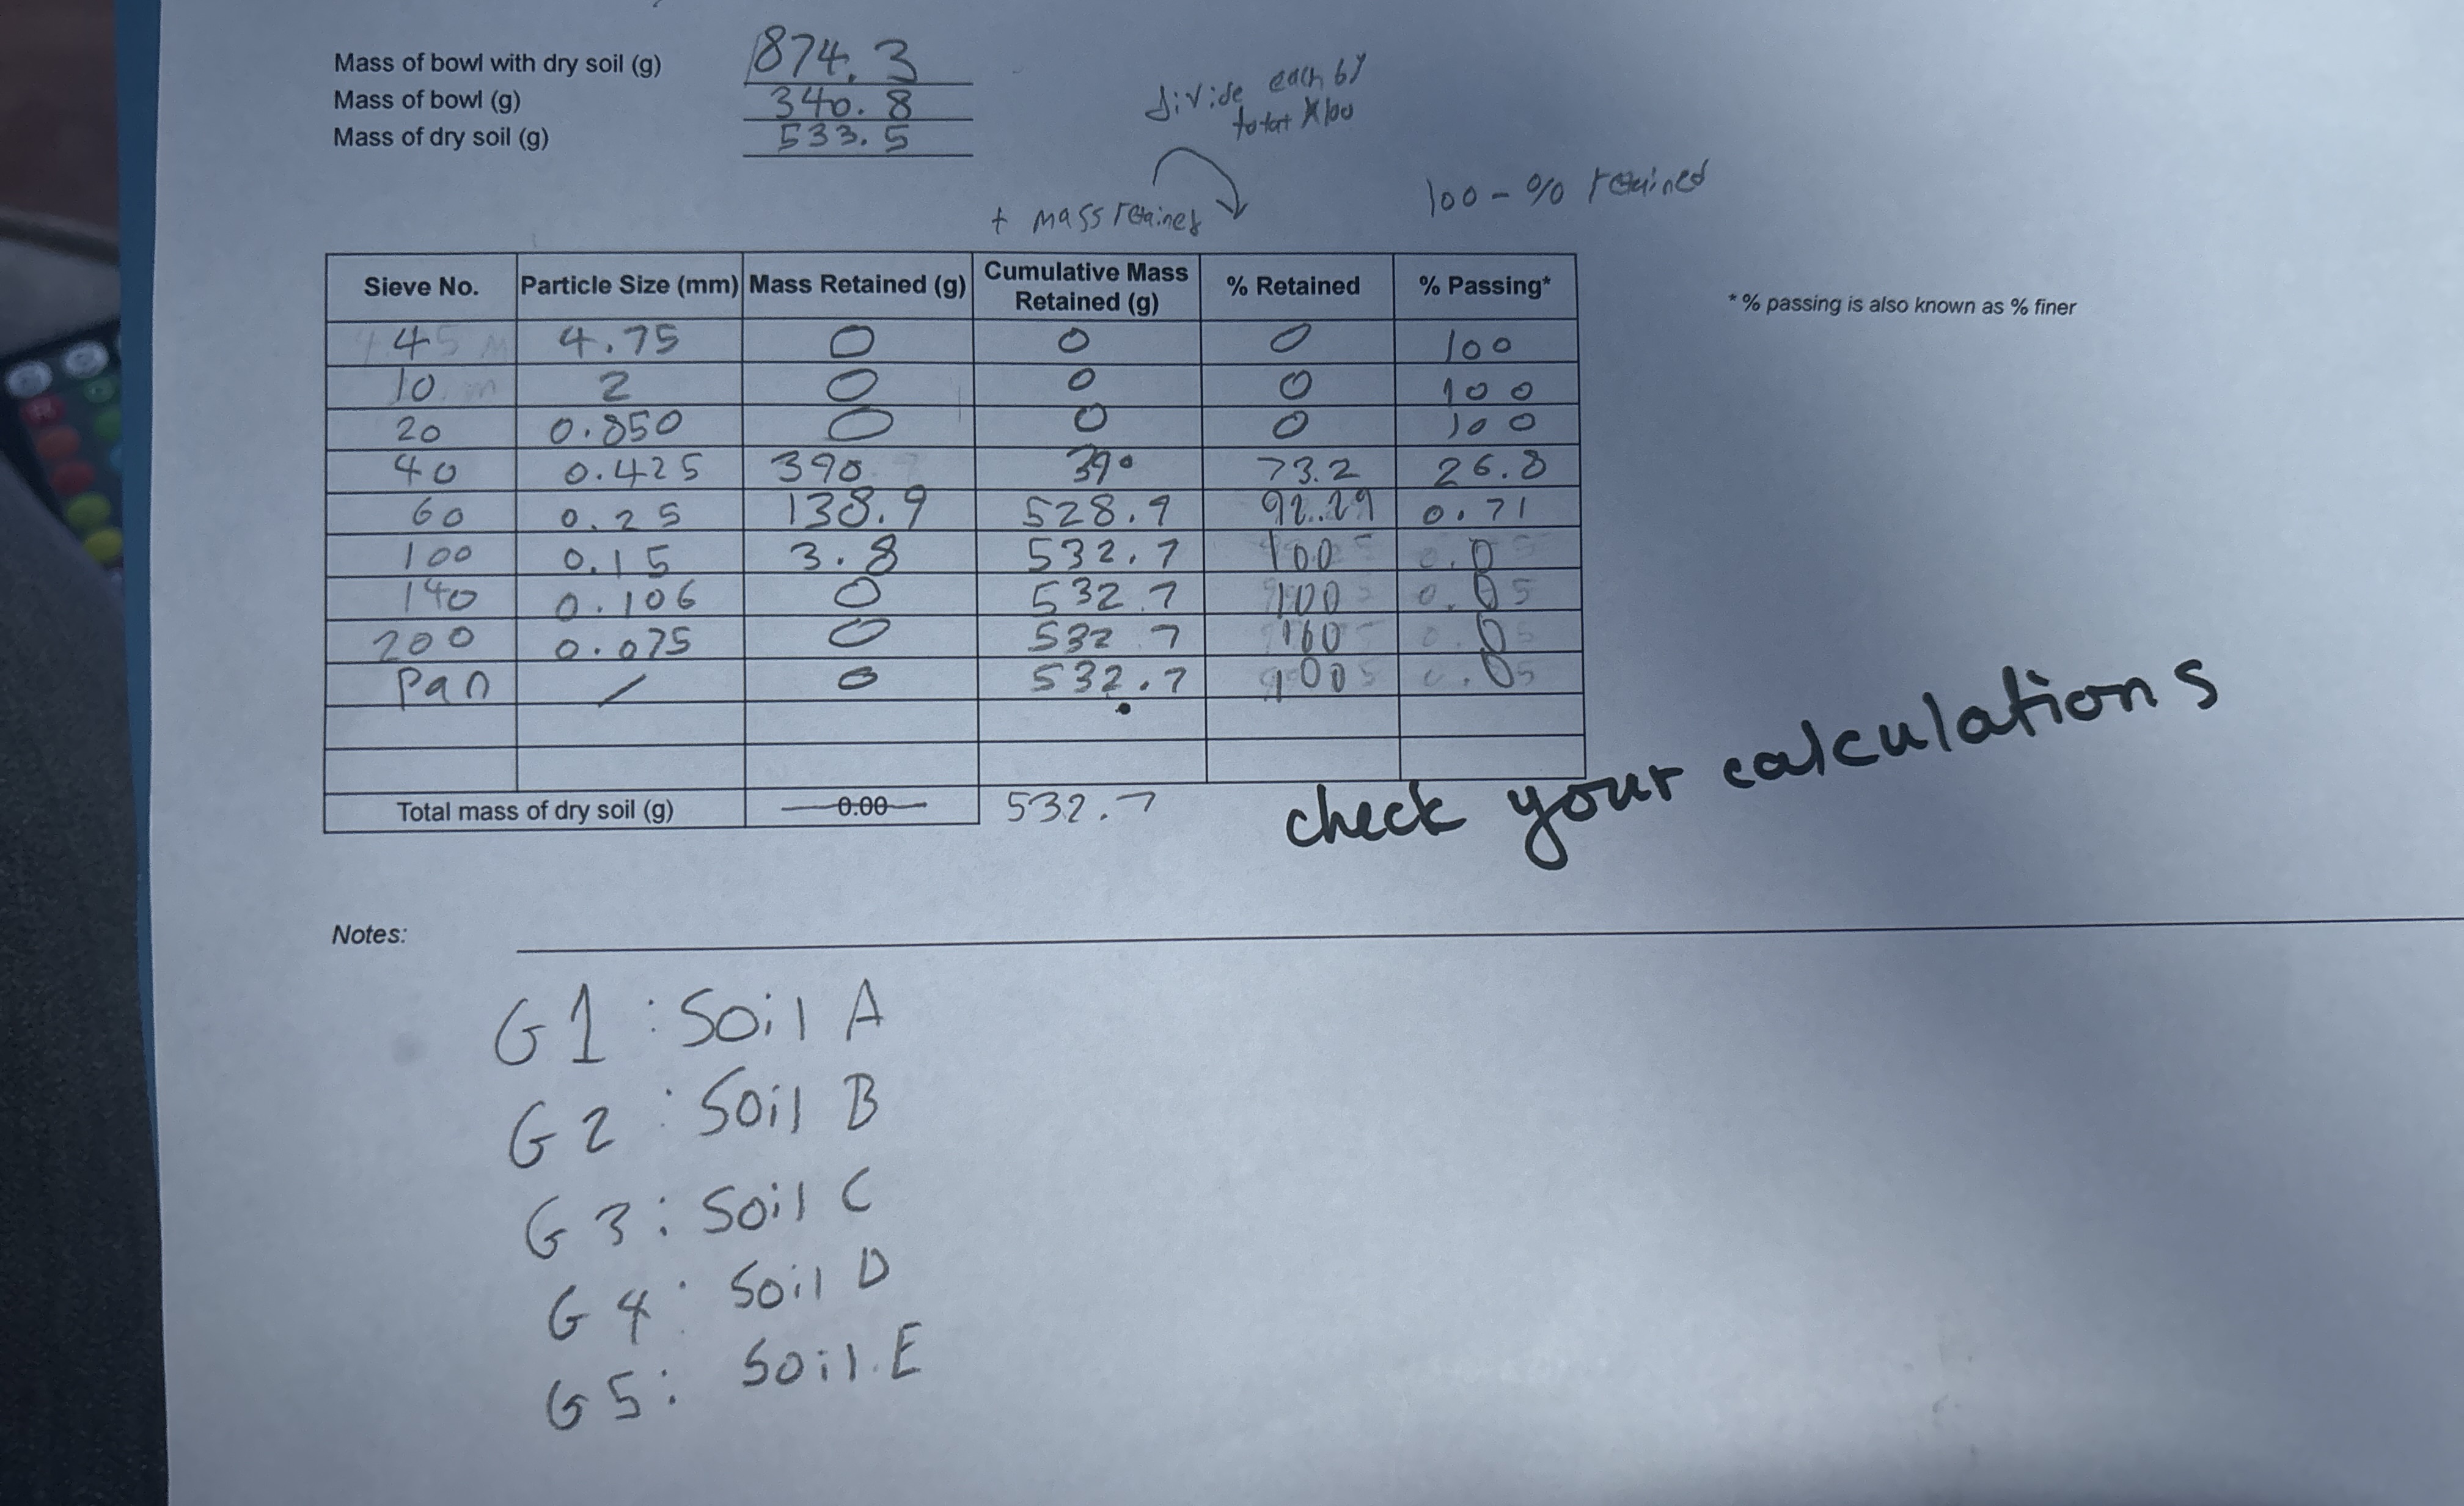
Question: State explicitly that sieve analyses were conducted for five soil samples ( Samples A through E ) and include a photograph of each sample. Develop
State explicitly that sieve analyses were conducted for five soil samples Samples A through E and include a photograph of each sample. Develop a particlesize distribution gradation curve for each soil sanfple Samples A through E Plot all curves on the same graph. Do not draw the curves by hand; do this in Excel. Include the graph in both the Excel spreadsheet and the report PDF Prepare a table that summarizes the following characteristics for each soil sample SamplesA through E: gravel, sand, and fines Coefficient of uniformity Cu and coefficient of curvature C Whether soil is finegrained or coarsegrained USCS designation must include group symbol and group name If a soil cannot be classified per USCS at this time, state that explicitly and explain briefly why that is the case. Are the USCS designations for the five soil samples Samples A through E in agreement with your expectations based on visualmanual classifications of these soil samples identifications made in class andor by looking at the photographs Explain.
Step by Step Solution
There are 3 Steps involved in it
1 Expert Approved Answer
Step: 1 Unlock

Question Has Been Solved by an Expert!
Get step-by-step solutions from verified subject matter experts
Step: 2 Unlock
Step: 3 Unlock