

Question: State relationship , Conclusion & attatch the graph for below given data in table... Thankss 1. Study the following data table and then Create a

State relationship , Conclusion & attatch the graph for below given data in table... Thankss
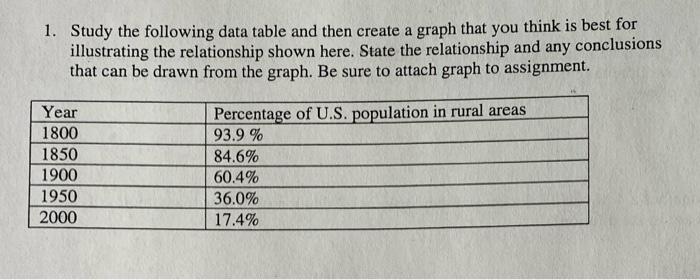
1. Study the following data table and then Create a graph that you think is best for illustrating the relationship shown here. State the relationship and any conclusions that can be drawn from the graph. Be sure to attach graph to assignment. Year 1800 1850 1900 1950 2000 ulation in rural areas Percent e Of U.S. 93.9 % 84.6% 60.4% 36.0% 17.4%
Step by Step Solution
There are 3 Steps involved in it
1 Expert Approved Answer
Step: 1 Unlock

Question Has Been Solved by an Expert!
Get step-by-step solutions from verified subject matter experts
Step: 2 Unlock
Step: 3 Unlock