

Question: StatGraphics XVII: Describe - Categorical Variable - Tabulation Put SHELF in Data, then click OK. Select, Frequency Table, Bar Chart, and Pie Chart (and deselect
StatGraphics XVII: Describe - Categorical Variable - Tabulation Put SHELF in Data, then click OK. Select, Frequency Table, Bar Chart, and Pie Chart (and deselect everything else) Paste these three output panes into your homework.
2. Define one statistic from the above output, and calculate its value.
3. Describe the distribution of SHELF based on the above output.
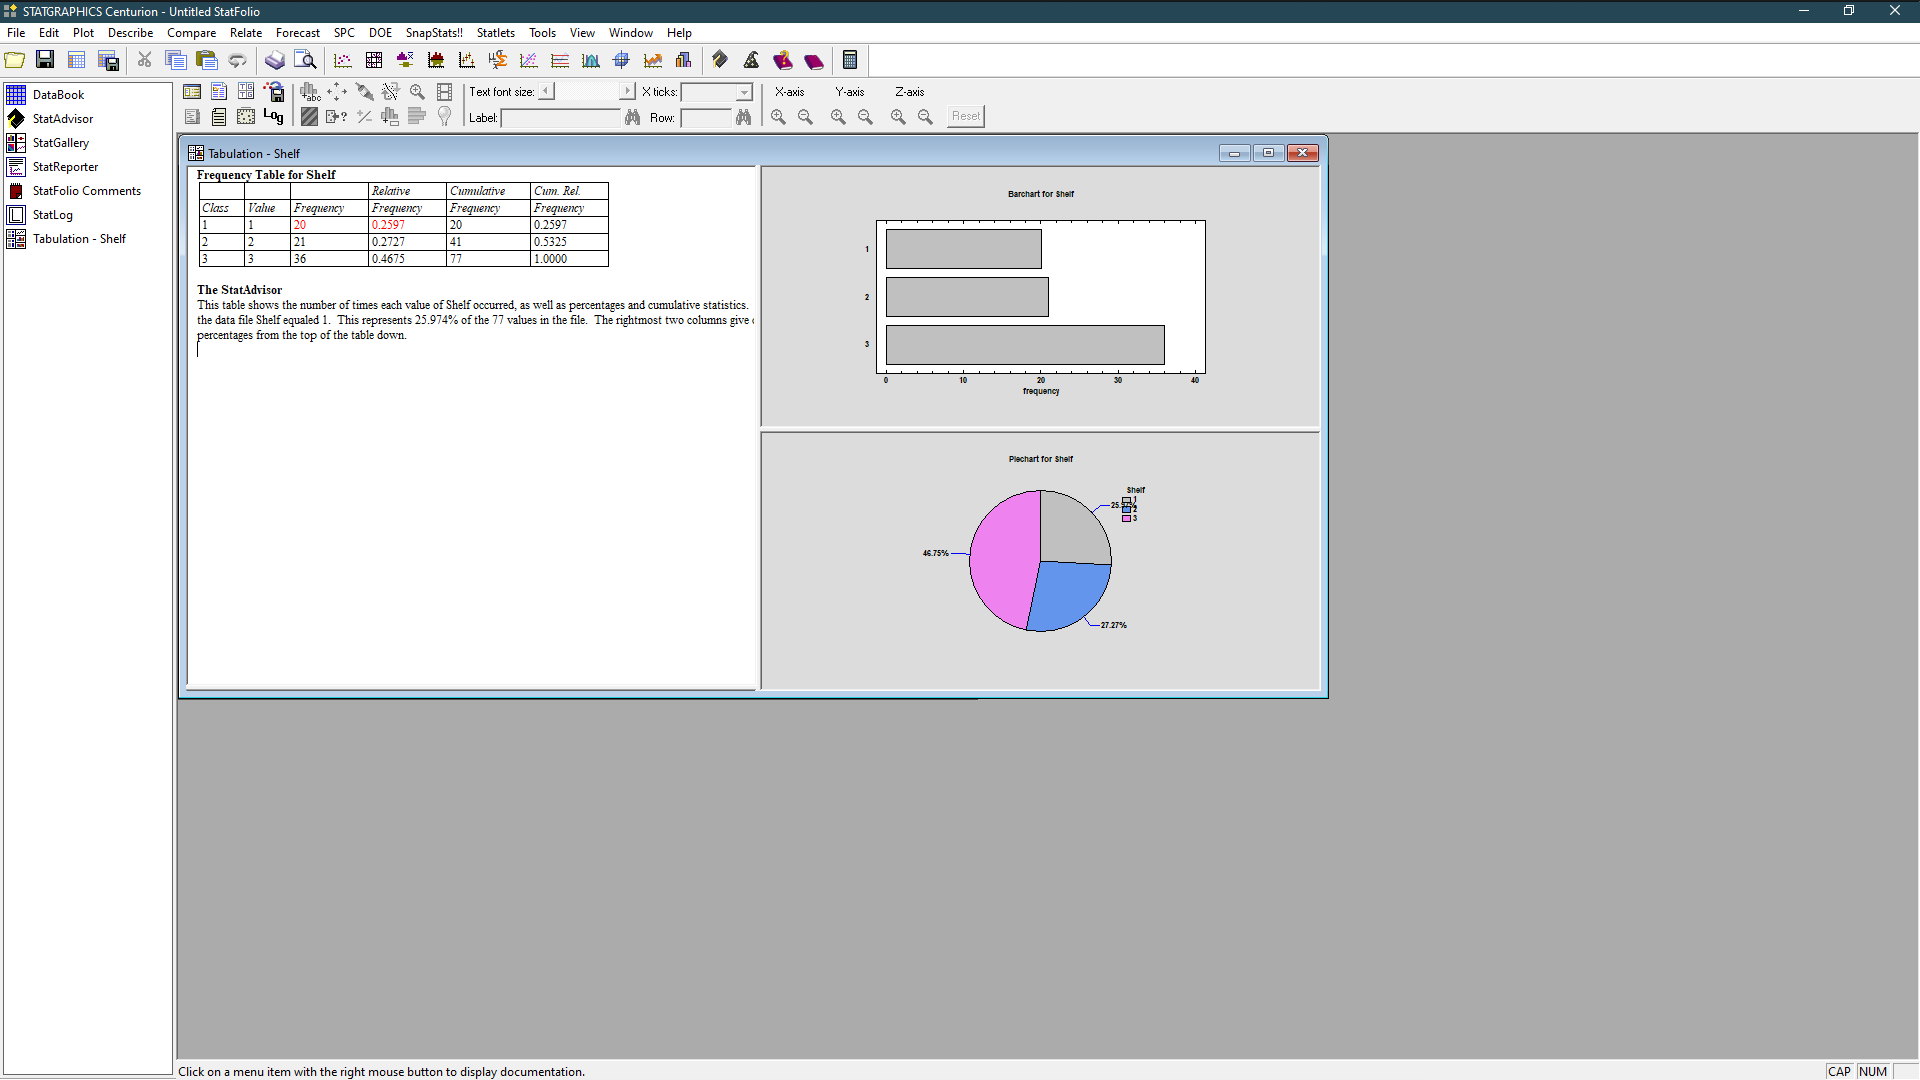
STATGRAPHICS Centurion - Untitled StatFolio File e Edit Plot Describe Compare Relate Forecast SPC DOE SnapStats! Statlets Tools View Window Help DataBook 6 6 8 |Text font size: X ticks: X-axis Y-axis Z-axis StatAdvisor 104g|70: X Q Y Label: Row: 1 12 8 2 8 8 8 Reset StatGallery StatReporter Tabulation - Shelf Frequency Table for Shelf -OX StatFolio Comments Relative Cumulative Cum. Rel. StatLog Class Value Frequency Frequency Frequency Frequency Barchart for Shelf Tabulation - Shelf 0.2597 20 0.2597 0.272 41 0.5325 0.4675 1.0000 The StatAdvisor This table shows the number of times each value of Shelf occurred, as well as percentages and cumulative statistics. the data file Shelf equaled 1. This represents 25.974% of the 77 values in the file. The rightmost two columns give . ercentages from the top of the table down. frequency Plechart for shelf shait 46.75% - 27.27% se button to display documentation. CAP NUM
Step by Step Solution
There are 3 Steps involved in it

Get step-by-step solutions from verified subject matter experts