

Question: Statist Pre X Practic Sample S STAT_1 9 Lab 01 5 1000s Sample W Charle Setting New Tab + anitoba.ca/pluginfile.php/128846/mod_resource/content/1/Practice%20Midterms.pdf The next three questions (7
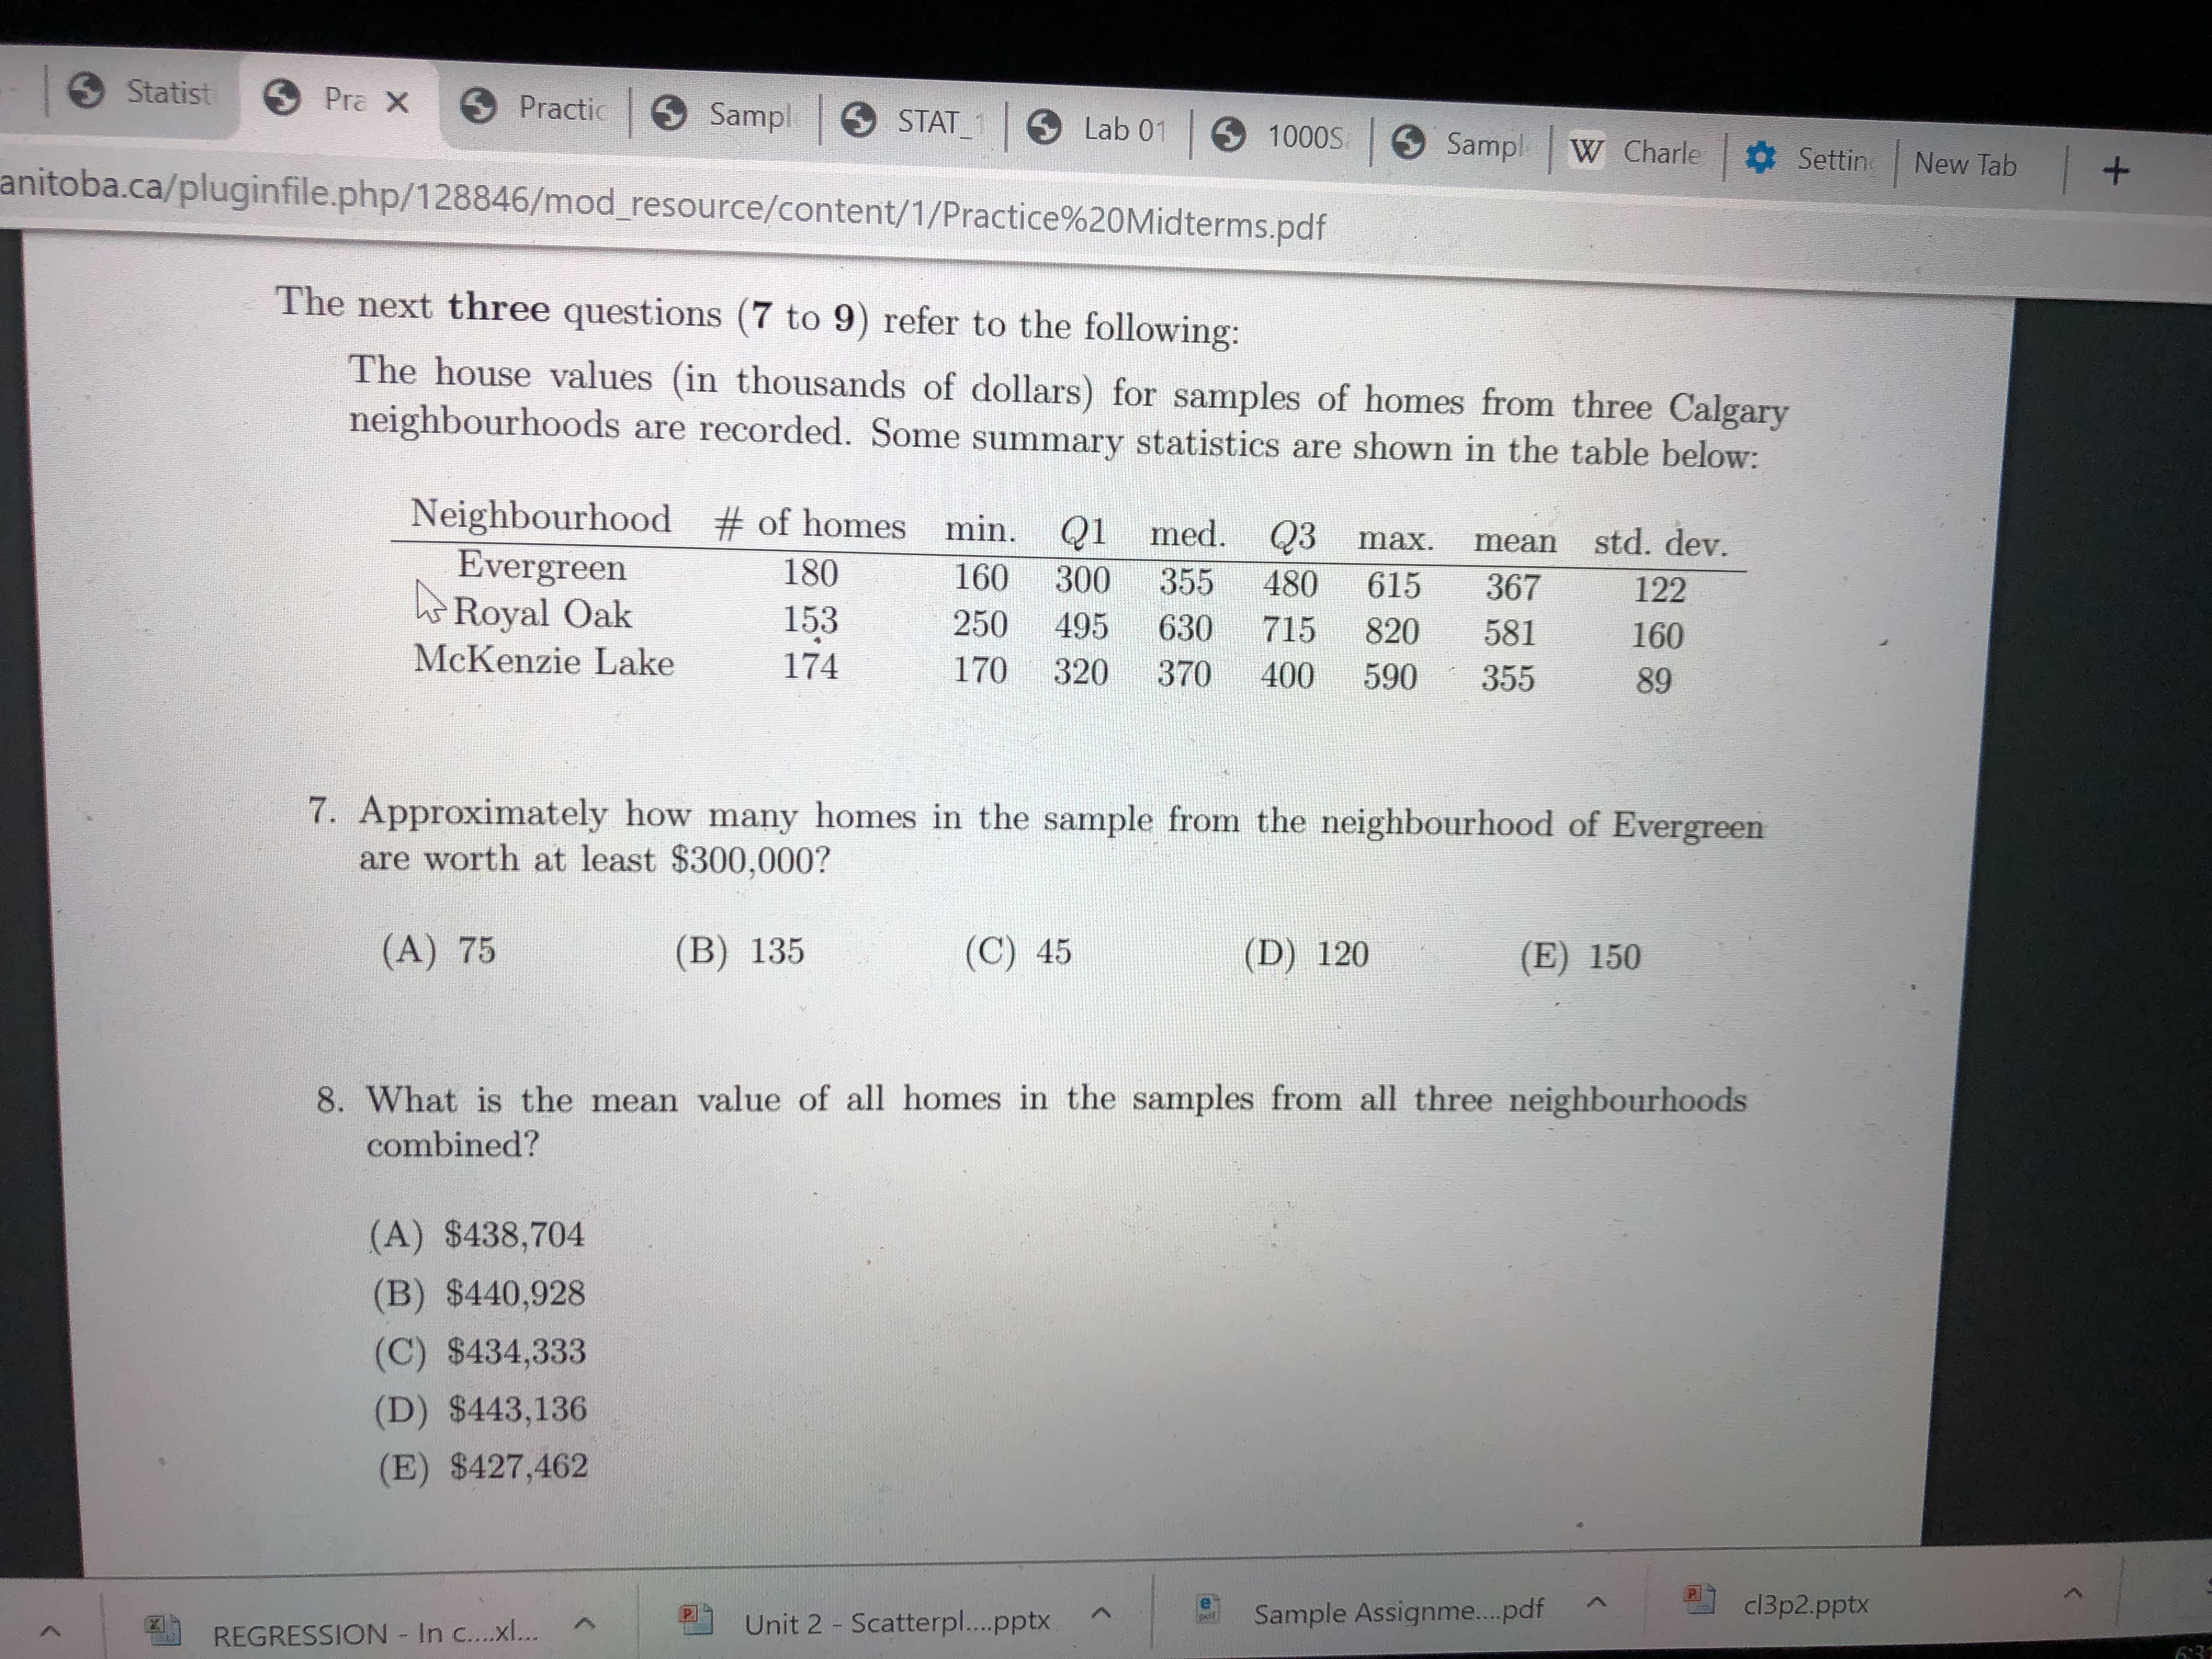
Statist Pre X Practic Sample S STAT_1 9 Lab 01 5 1000s Sample W Charle Setting New Tab + anitoba.ca/pluginfile.php/128846/mod_resource/content/1/Practice%20Midterms.pdf The next three questions (7 to 9) refer to the following: The house values (in thousands of dollars) for samples of homes from three Calgary neighbourhoods are recorded. Some summary statistics are shown in the table below: Neighbourhood # of homes min. Q1 med. Q3 max. mean std. dev. Evergreen 180 he Royal Oak 160 300 355 480 615 367 122 153 250 495 630 715 820 581 160 Mckenzie Lake 174 170 320 370 400 590 355 89 7. Approximately how many homes in the sample from the neighbourhood of Evergreen are worth at least $300,000? (A) 75 (B) 135 (C) 45 (D) 120 (E) 150 8. What is the mean value of all homes in the samples from all three neighbourhoods combined? (A) $438,704 (B) $440,928 (C) $434,333 (D) $443,136 (E) $427,462 c13p2.pptx REGRESSION - In c....x1... ~ Unit 2 - Scatterpl..pptx Sample Assignme..pdf
Step by Step Solution
There are 3 Steps involved in it

Get step-by-step solutions from verified subject matter experts