

Question: STATISTICAL ANALYSIS Referring to the given frequency distribution table, what is the mean? * 2 points Class Limits Class Mark Frequency Class Boundary Fdown (X)
STATISTICAL ANALYSIS
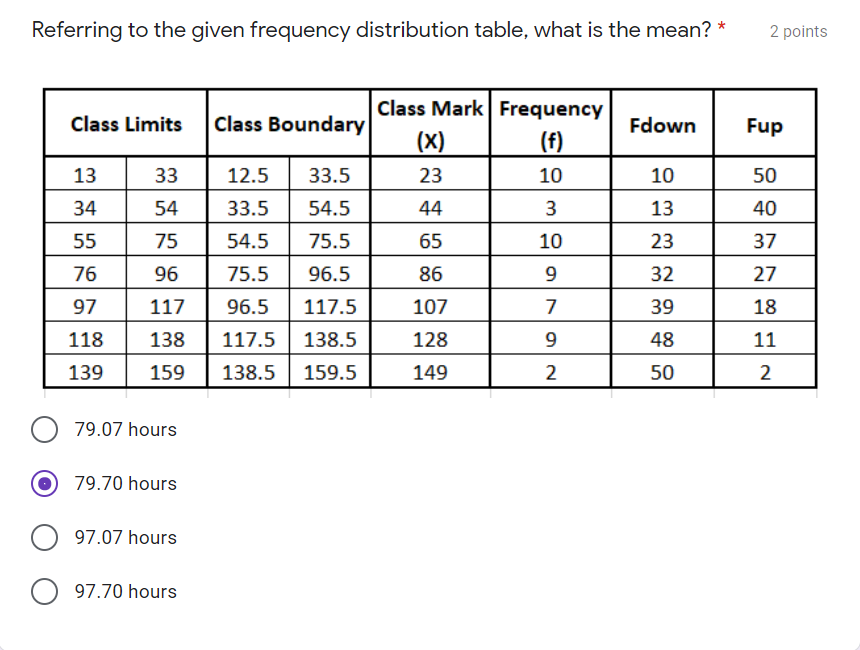
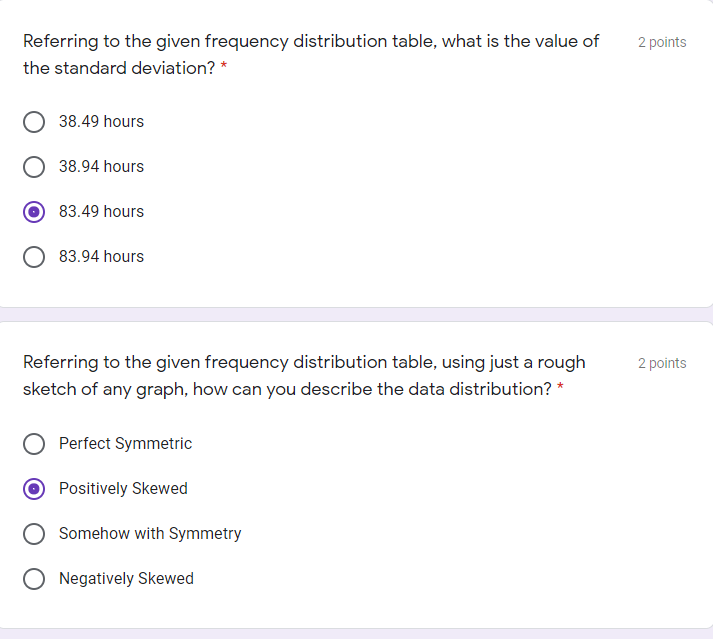
Referring to the given frequency distribution table, what is the mean? * 2 points Class Limits Class Mark Frequency Class Boundary Fdown (X) Fup (f) 13 33 12.5 33.5 23 10 10 50 34 54 33.5 54.5 44 3 13 40 55 75 54.5 75.5 65 10 23 37 76 96 75.5 96.5 86 9 32 27 97 117 96.5 117.5 107 7 39 18 118 138 117.5 138.5 128 9 48 11 139 159 138.5 159.5 149 2 50 2 79.07 hours 79.70 hours 97.07 hours 97.70 hoursReferring to the given frequency distribution table, what is the value of 2 points the standard deviation? * O 38.49 hours O 38.94 hours O 83.49 hours O 83.94 hours Referring to the given frequency distribution table, using just a rough 2 points sketch of any graph, how can you describe the data distribution? * Perfect Symmetric O Positively Skewed Somehow with Symmetry O Negatively Skewed
Step by Step Solution
There are 3 Steps involved in it

Get step-by-step solutions from verified subject matter experts