

Question: Statistical Guide Like a t test, a one-way analysis of variance (ANOVA) can be used to determine the signifi- cance of the difference between two
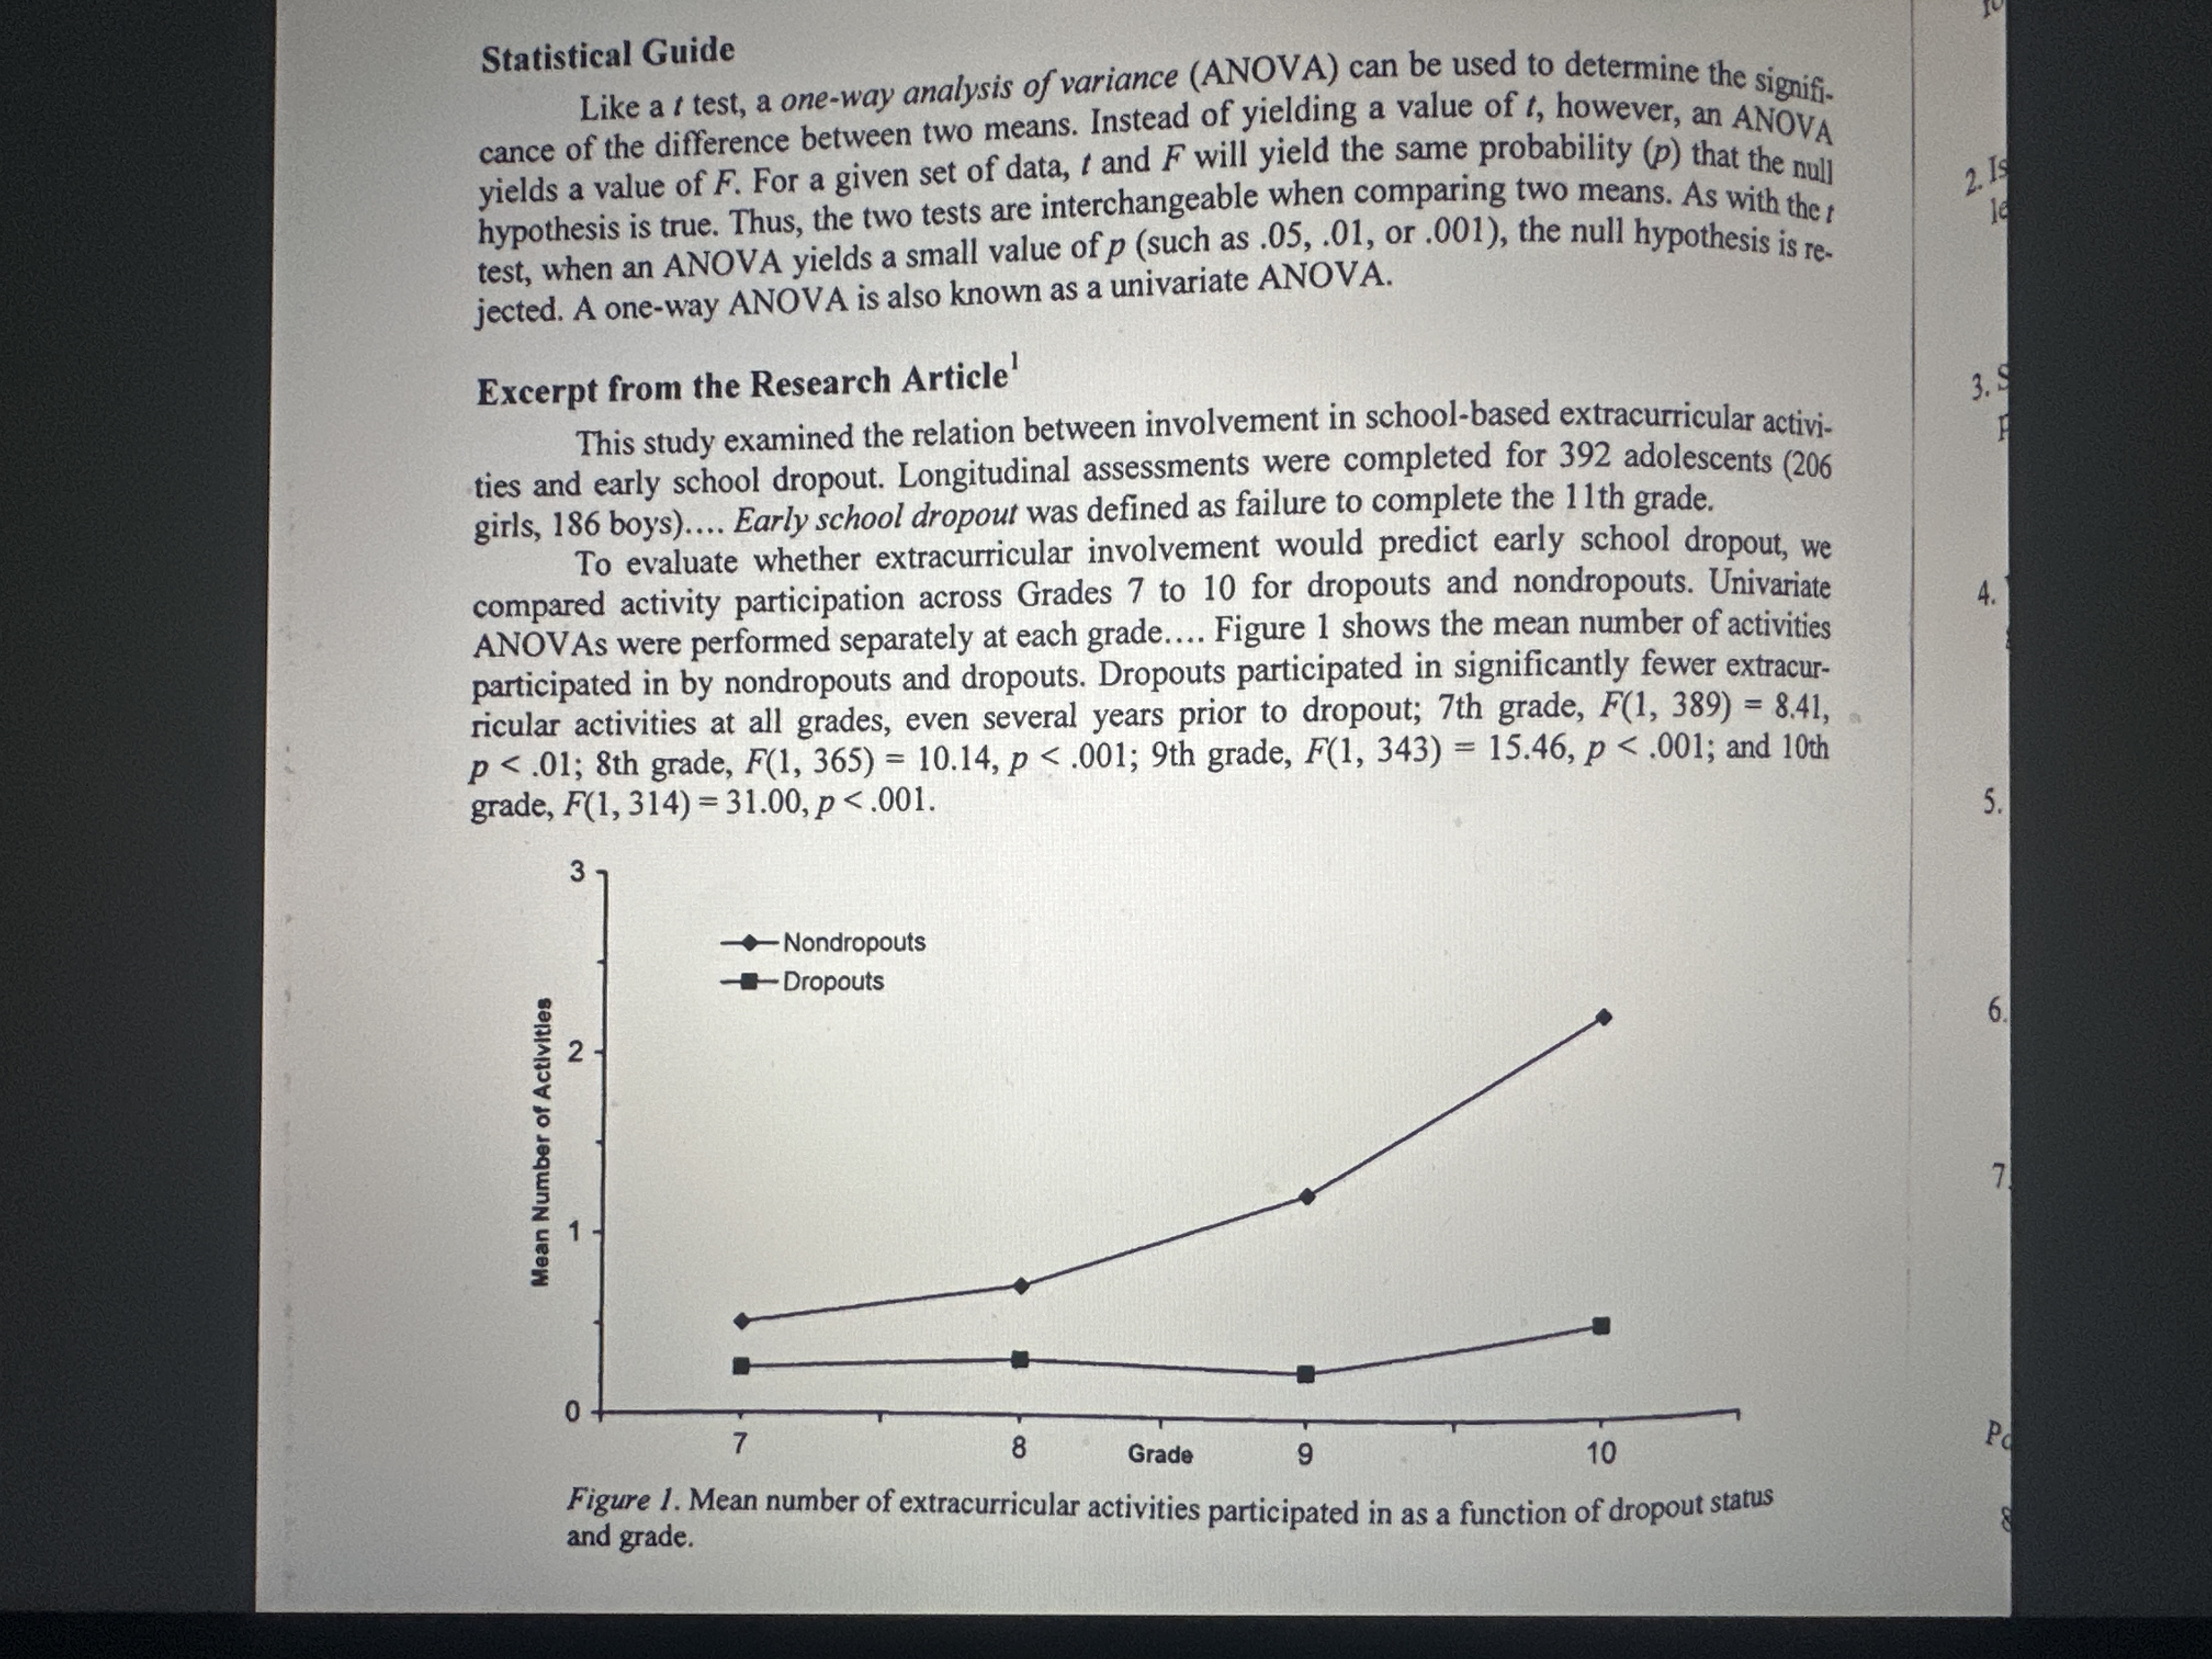
Statistical Guide Like a t test, a one-way analysis of variance (ANOVA) can be used to determine the signifi- cance of the difference between two means. Instead of yielding a value of , however, an ANOVA yields a value of F. For a given set of data, t and F will yield the same probability (p) that the null hypothesis is true. Thus, the two tests are interchangeable when comparing two means. As with the ; 2. Is test, when an ANOVA yields a small value of p (such as .05, .01, or .001), the null hypothesis is re- jected. A one-way ANOVA is also known as a univariate ANOVA. Excerpt from the Research Article This study examined the relation between involvement in school-based extracurricular activi 3. ties and early school dropout. Longitudinal assessments were completed for 392 adolescents (206 girls, 186 boys).... Early school dropout was defined as failure to complete the 1 1th gr To evaluate whether extracurricular involvement would predict early school dropout, we compared activity participation across Grades 7 to 10 for dropouts and nondropouts. Univariate ANOVAs were performed separately at each grade.... Figure 1 shows the mean number of activities participated in by nondropouts and dropouts. Dropouts participated in significantly fewer extracur- ricular activities at all grades, even several years prior to dropout; 7th grade, F(1, 389) = 8.41, p <.01 grade f p .001 and nondropouts dropouts mean number of activities pd grade. figure extracurricular participated in as a function dropout statusquestions for exercise part a: factual questions according to i at which level was the average most similar is difference referred question statistically significant if yes what probability it should null hypothesis be rejected so that random sampling errors created between two groups means explain. how many are being compared each a. more than differences other levels. b. less levels.significant b: discussion researchers indicate their study longitudinal. do you think this term not report standard deviations associated with means. would interested knowing macbook air dii dd>
Step by Step Solution
There are 3 Steps involved in it

Get step-by-step solutions from verified subject matter experts