

Question: Statistical Process Control Chart 2. Statistical Process Control Chart Table 2 shows the slip-ring diameter (cm) at ga Engineering. I aNIE
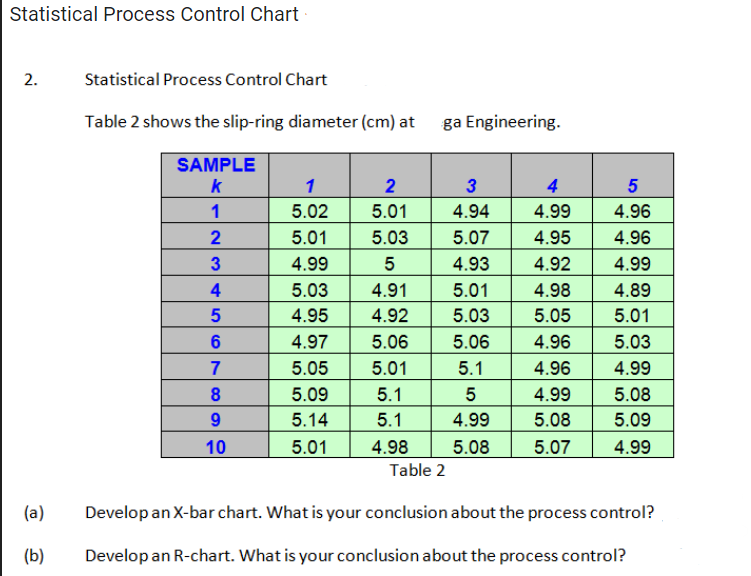
Statistical Process Control Chart 2. Statistical Process Control Chart Table 2 shows the slip-ring diameter (cm) at ga Engineering. I aNIE
Step by Step Solution
There are 3 Steps involved in it
1 Expert Approved Answer
Step: 1 Unlock

Question Has Been Solved by an Expert!
Get step-by-step solutions from verified subject matter experts
Step: 2 Unlock
Step: 3 Unlock