

Question: Statistically interpret the table below, Category N p- Correlation value Interpretation Decision of Students ept 160 .224** 0.004 Significant Covid Liteacy p>0.05 not significant N=
Statistically interpret the table below,
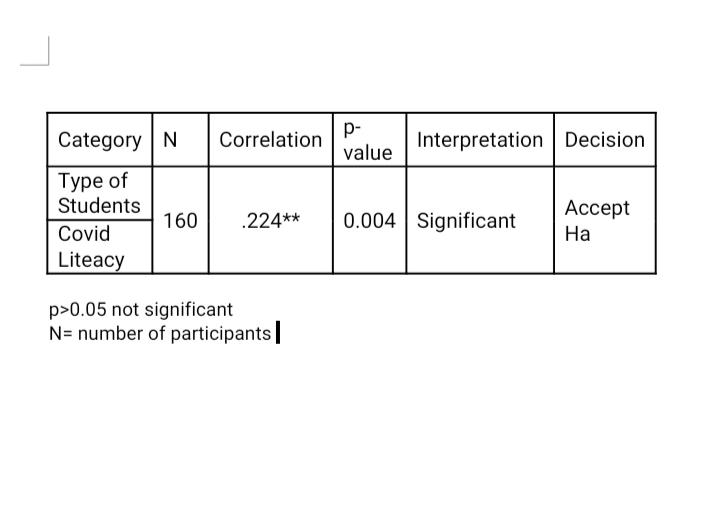
Category N p- Correlation value Interpretation Decision of Students ept 160 .224** 0.004 Significant Covid Liteacy p>0.05 not significant N= number of participants|
Step by Step Solution
★★★★★
3.39 Rating (165 Votes )
There are 3 Steps involved in it
1 Expert Approved Answer
Step: 1 Unlock

The table indicated that sample contains 160 students and correlation ... View full answer
Question Has Been Solved by an Expert!
Get step-by-step solutions from verified subject matter experts
Step: 2 Unlock
Step: 3 Unlock