

Question: Statistics (1) What are type I and type II errors? On the graph below indicate the area for the ? value (probability of type I
Statistics
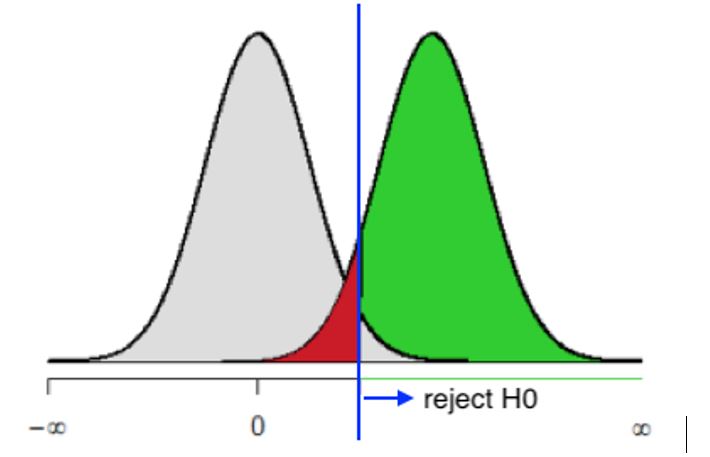
(1) What are type I and type II errors? On the graph below indicate the area for the ? value (probability of type I error when the null hypothesis is true) and the ? value (probability of type II error when the alternative hypothesis is true). The "grey" area is the null hypothesis and the "green" area is the alternate hypothesis.
\f\f
Step by Step Solution
There are 3 Steps involved in it
1 Expert Approved Answer
Step: 1 Unlock

Question Has Been Solved by an Expert!
Get step-by-step solutions from verified subject matter experts
Step: 2 Unlock
Step: 3 Unlock