

Question: statistics 14 Construct the requested histogram. 14) During the quality control process at a manufacturing plant, 142 14) finished items are randomly selected and weighed.
statistics 14
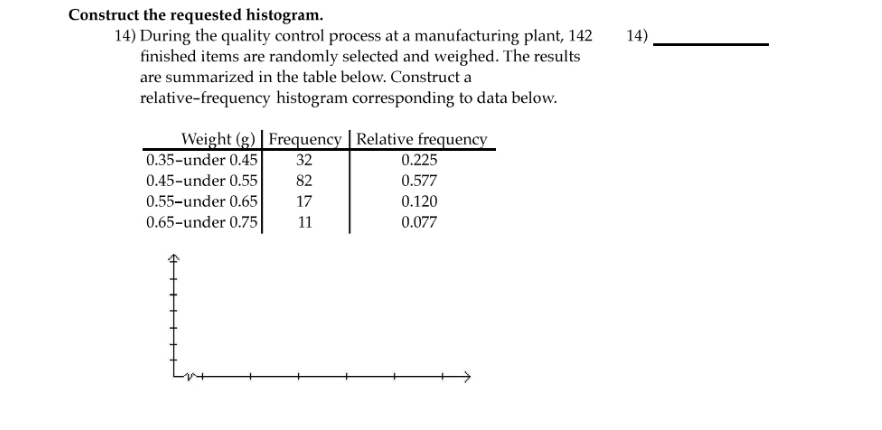
Construct the requested histogram. 14) During the quality control process at a manufacturing plant, 142 14) finished items are randomly selected and weighed. The results are summarized in the table below. Construct a relative-frequency histogram corresponding to data below. Weight (g) Frequency Relative frequency 0.35-under 0.45 32 0.225 0.45-under 0.55 82 0.577 0.55-under 0.65 17 0.120 0.65-under 0.75 11 0.077 L
Step by Step Solution
There are 3 Steps involved in it
1 Expert Approved Answer
Step: 1 Unlock

Question Has Been Solved by an Expert!
Get step-by-step solutions from verified subject matter experts
Step: 2 Unlock
Step: 3 Unlock