

Question: Statistics 2 Assignment 12 The following data on x=soil depth and y=percentage of montmorillonite in the soil were analyzed from samples taken in Belize X
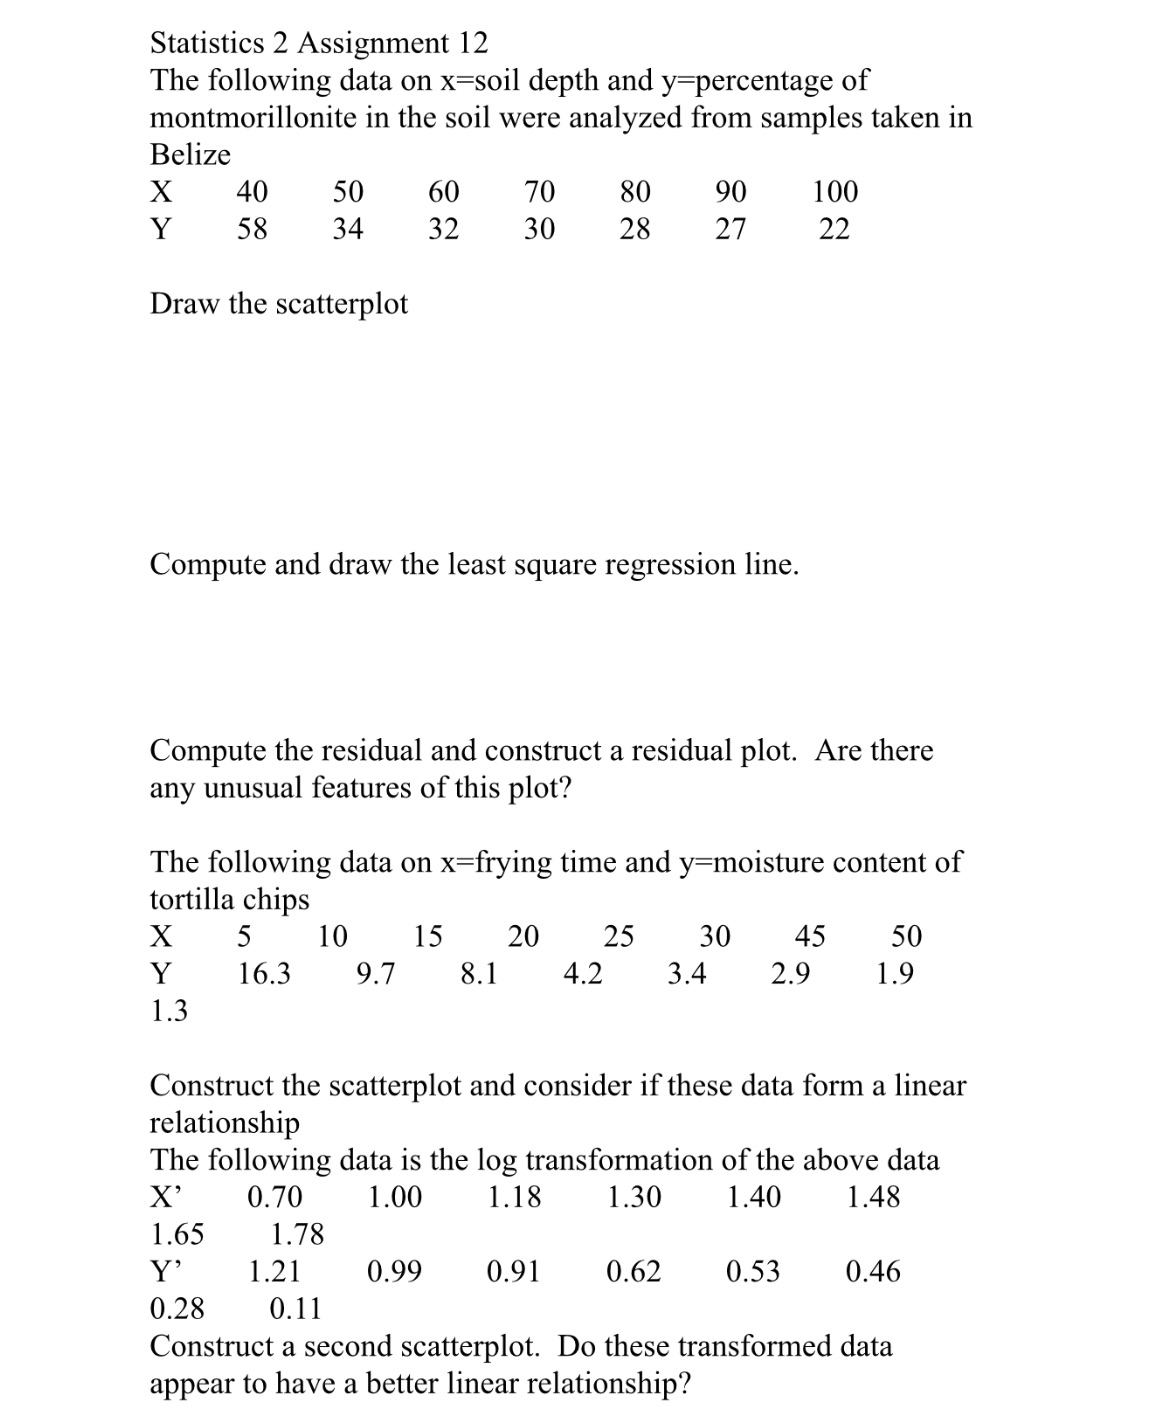
Statistics 2 Assignment 12 The following data on x=soil depth and y=percentage of montmorillonite in the soil were analyzed from samples taken in Belize X 40 50 60 70 80 90 100 Y 58 34 32 30 28 27 22 Draw the scatterplot Compute and draw the least square regression line. Compute the residual and construct a residual plot. Are there any unusual features of this plot? The following data on x=frying time and y=moisture content of tortilla chips X 5 10 15 20 25 30 45 50 Y 16.3 9.7 8.1 4.2 3.4 2.9 1.9 1.3 Construct the scatterplot and consider if these data form a linear relationship The following data is the log transformation of the above data X' 0.70 1.00 1.18 1.30 1.40 1.48 1.65 1.78 Y' 1.21 0.99 0.91 0.62 0.53 0.46 0.28 0.11 Construct a second scatterplot. Do these transformed data appear to have a better linear relationship
Step by Step Solution
There are 3 Steps involved in it

Get step-by-step solutions from verified subject matter experts