

Question: statistics A regression model is fitted to data with 5 independent variables (X1, X2, X3, X4 and 's) and the output of the analysis using
statistics
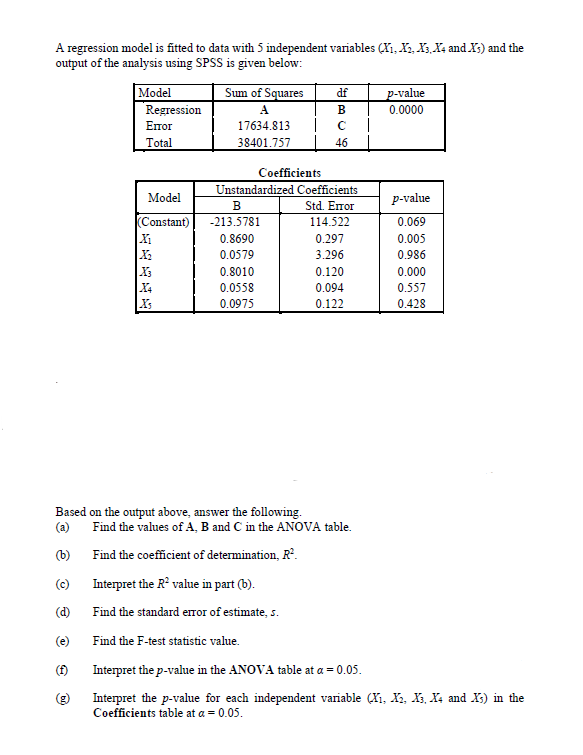
A regression model is fitted to data with 5 independent variables (X1, X2, X3, X4 and \\'s) and the output of the analysis using SPSS is given below: Model Sum of Squares df p-value Regression A B 0.0000 Error 17634.813 C Total 38401.757 46 Coefficients Model Unstandardized Coefficients B td. Error p-value (Constant) -213.5781 114.522 0.069 X1 0.8690 0.297 0.005 0.0579 3.296 0.986 X 0.8010 0.120 0.000 0.0558 0.094 0.557 0.0975 0.122 0.428 Based on the output above, answer the following. (a) Find the values of A, B and C in the ANOVA table. (b) Find the coefficient of determination, R. (c) Interpret the R" value in part (b). (d) Find the standard error of estimate, s. Find the F-test statistic value. ( f) Interpret the p-value in the ANOVA table at a = 0.05. (g) Interpret the p-value for each independent variable (X1, X2, X3, X4 and As) in the Coefficients table at a = 0.05
Step by Step Solution
There are 3 Steps involved in it

Get step-by-step solutions from verified subject matter experts