

Question: Statistics and Probability Assignments - STAT 154 X 5 STAT 154 Final Exam.pd X C Get Homework Help W X C UUUUUUUUUUUUUU8 X C Twenty-seven
Statistics and Probability
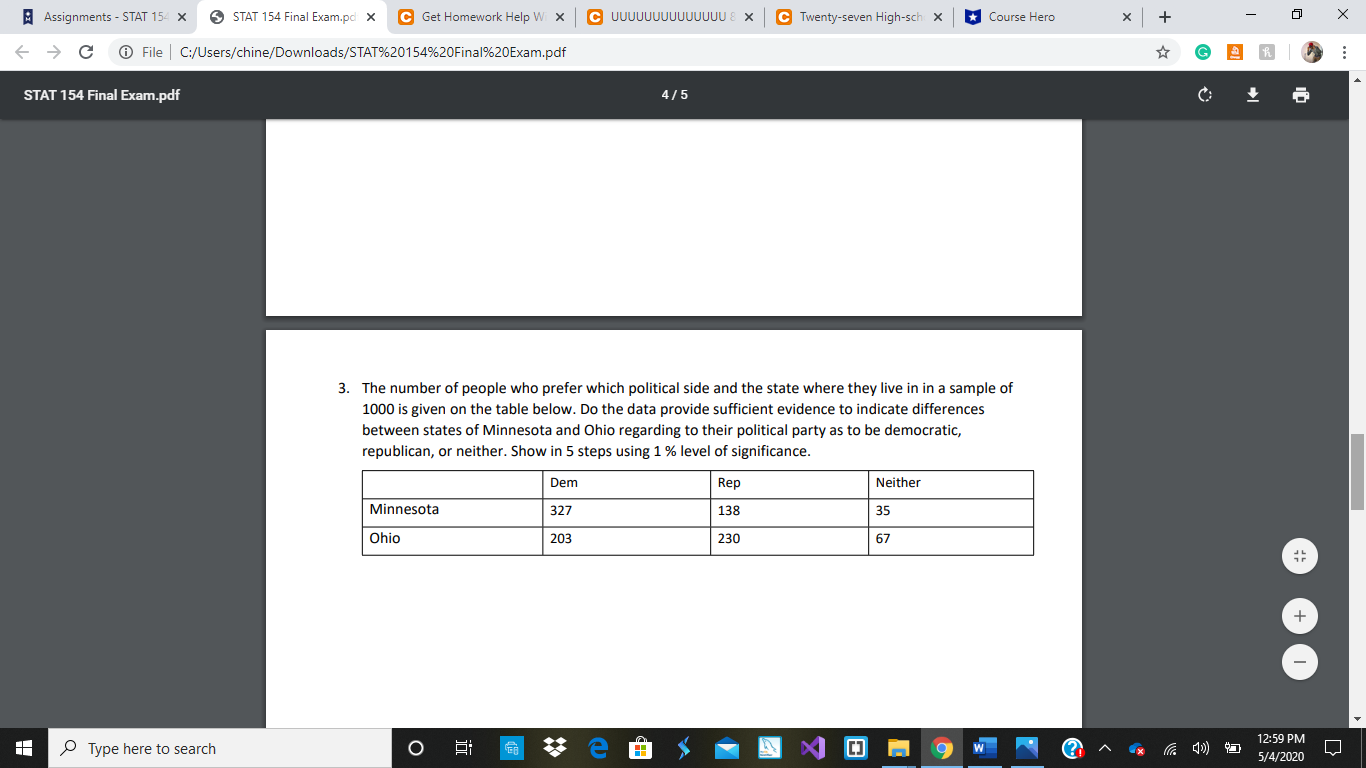
Assignments - STAT 154 X 5 STAT 154 Final Exam.pd X C Get Homework Help W X C UUUUUUUUUUUUUU8 X C Twenty-seven High-sch x * Course Hero X + X > C @ File | C:/Users/chine/Downloads/STAT%20154%20Final%20Exam.pdf GER C STAT 154 Final Exam.pdf 4/5 3. The number of people who prefer which political side and the state where they live in in a sample of 1000 is given on the table below. Do the data provide sufficient evidence to indicate differences between states of Minnesota and Ohio regarding to their political party as to be democratic, republican, or neither. Show in 5 steps using 1% level of significance. Dem Rep Neither Minnesota 327 138 35 Ohio 203 230 67 + Type here to search O X O m 9 12:59 PM 5/4/2020
Step by Step Solution
There are 3 Steps involved in it

Get step-by-step solutions from verified subject matter experts