

Question: Statistics and probability Exercise 03.38 Algorithmic Question 3 of 23 eBook Suppose the data have a bell-shaped distribution with a mean of 50 and a
Statistics and probability
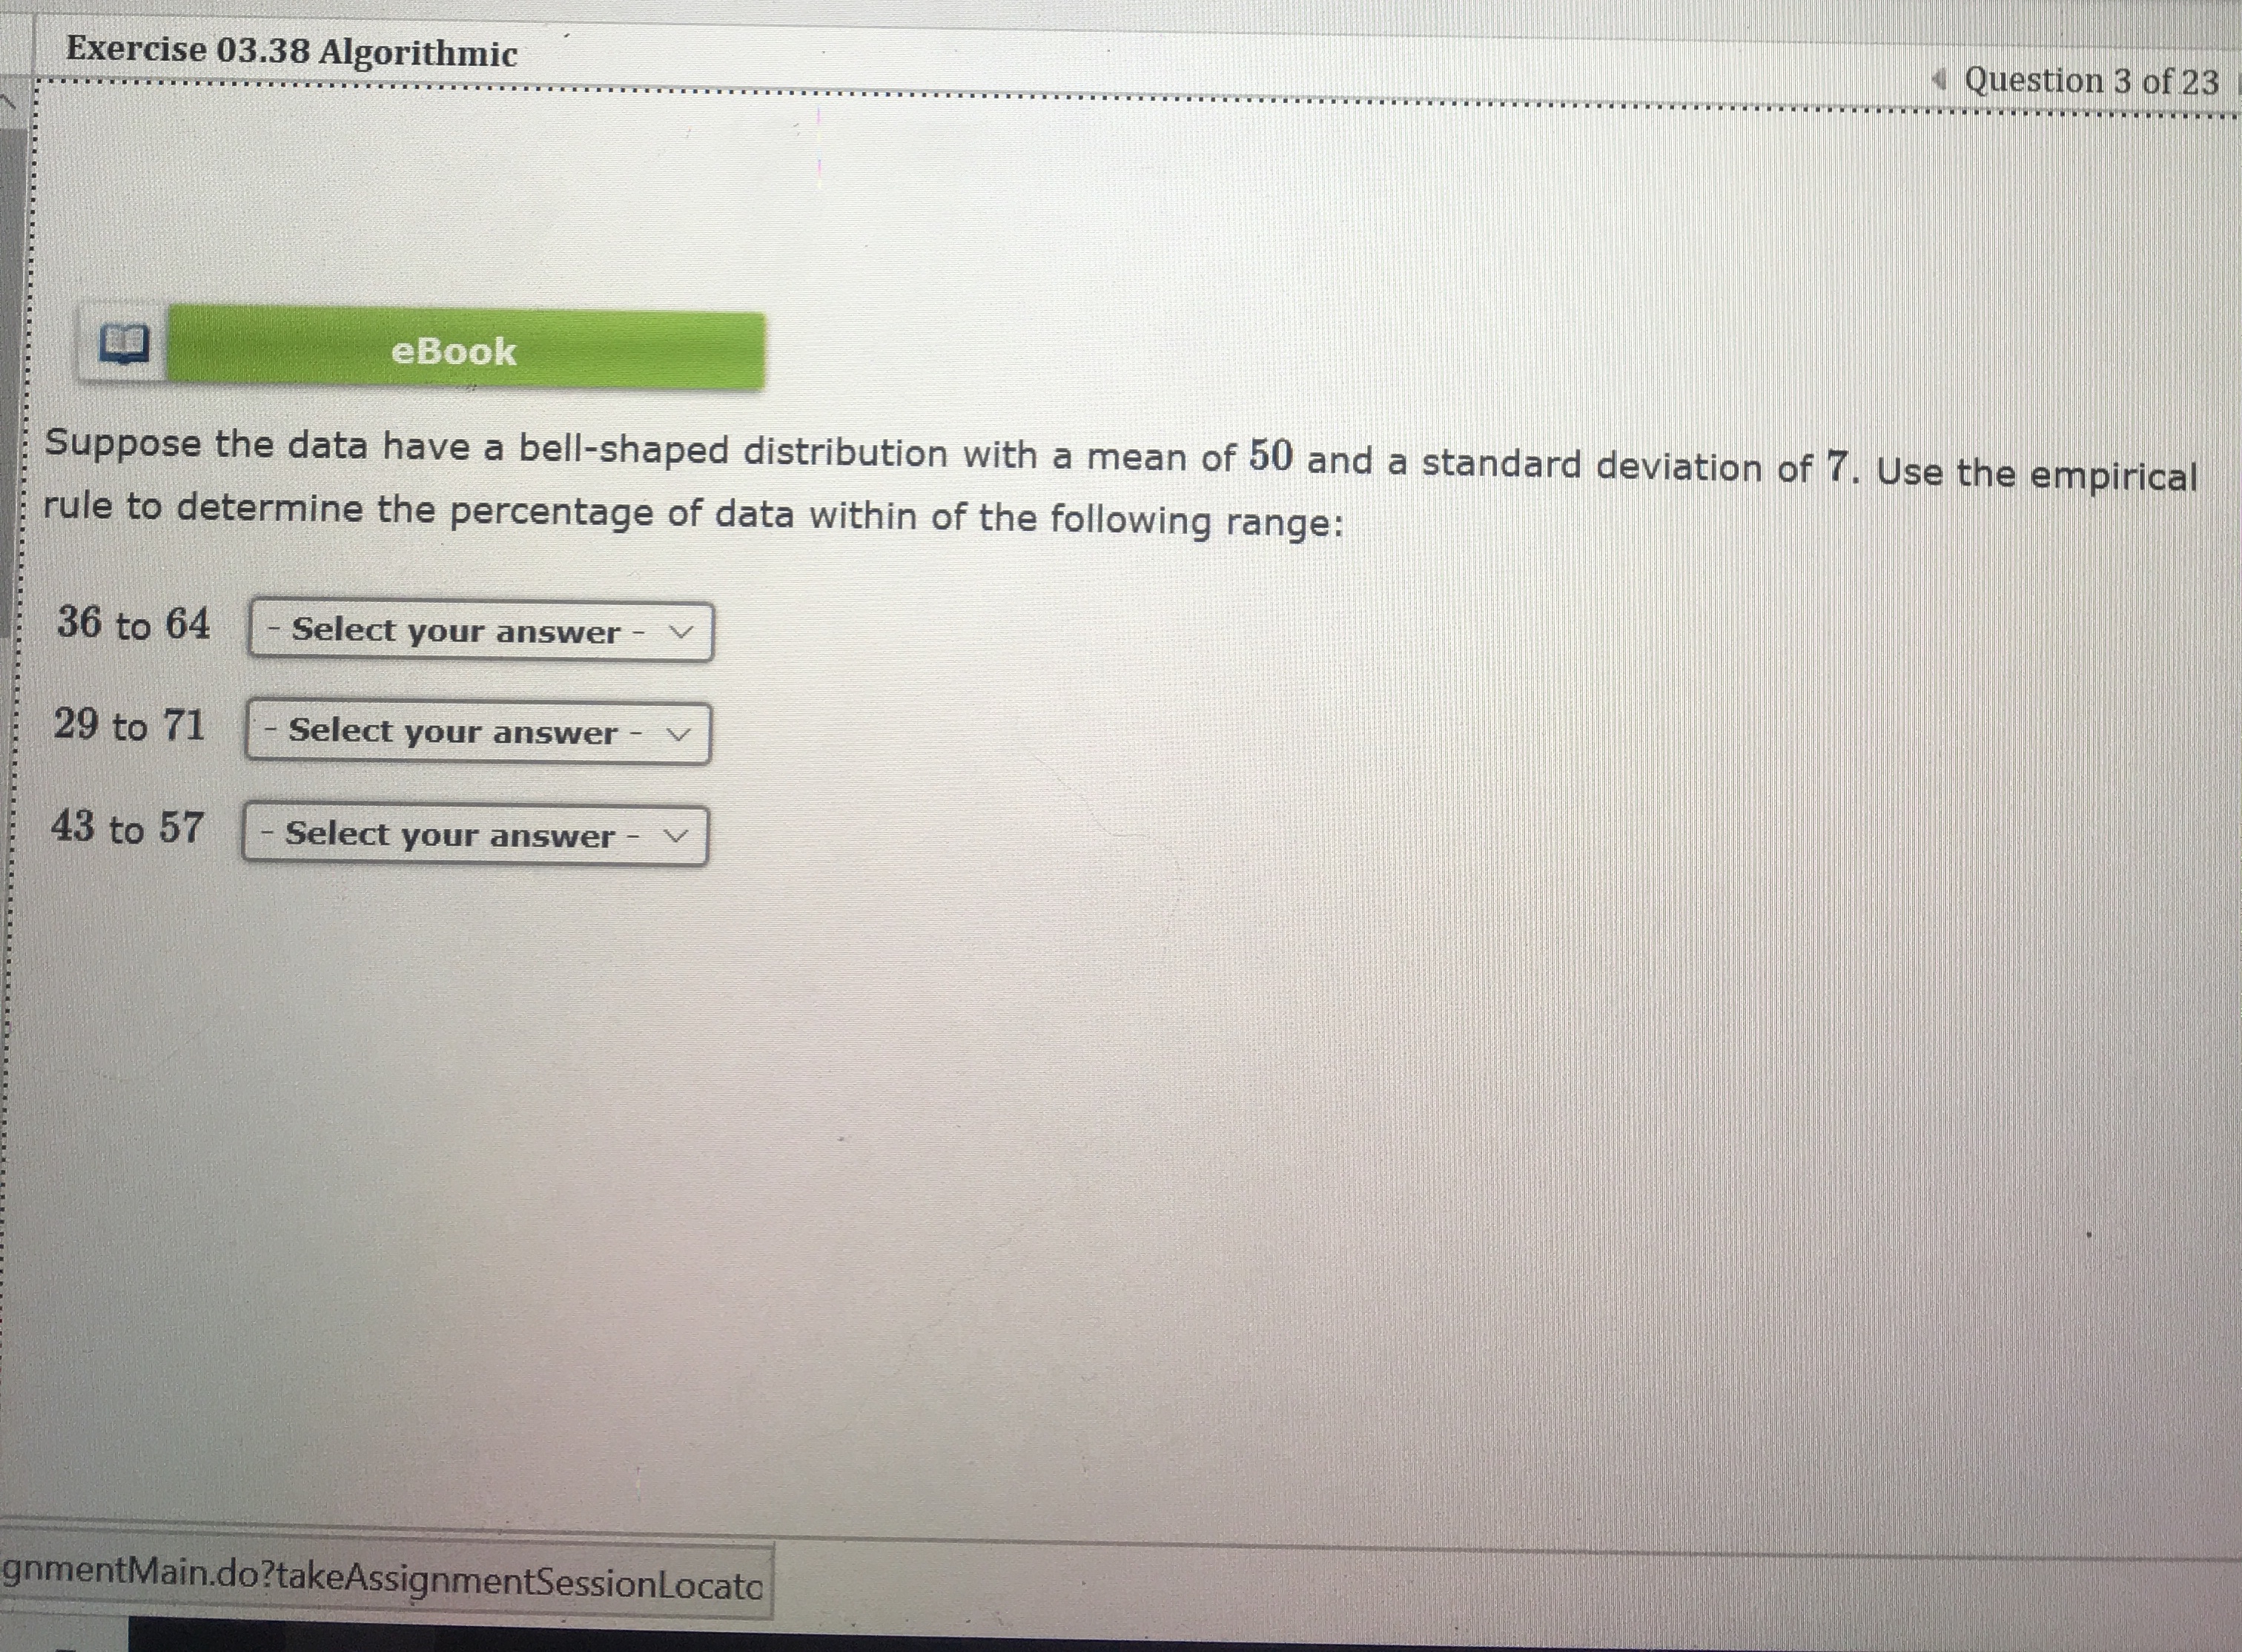
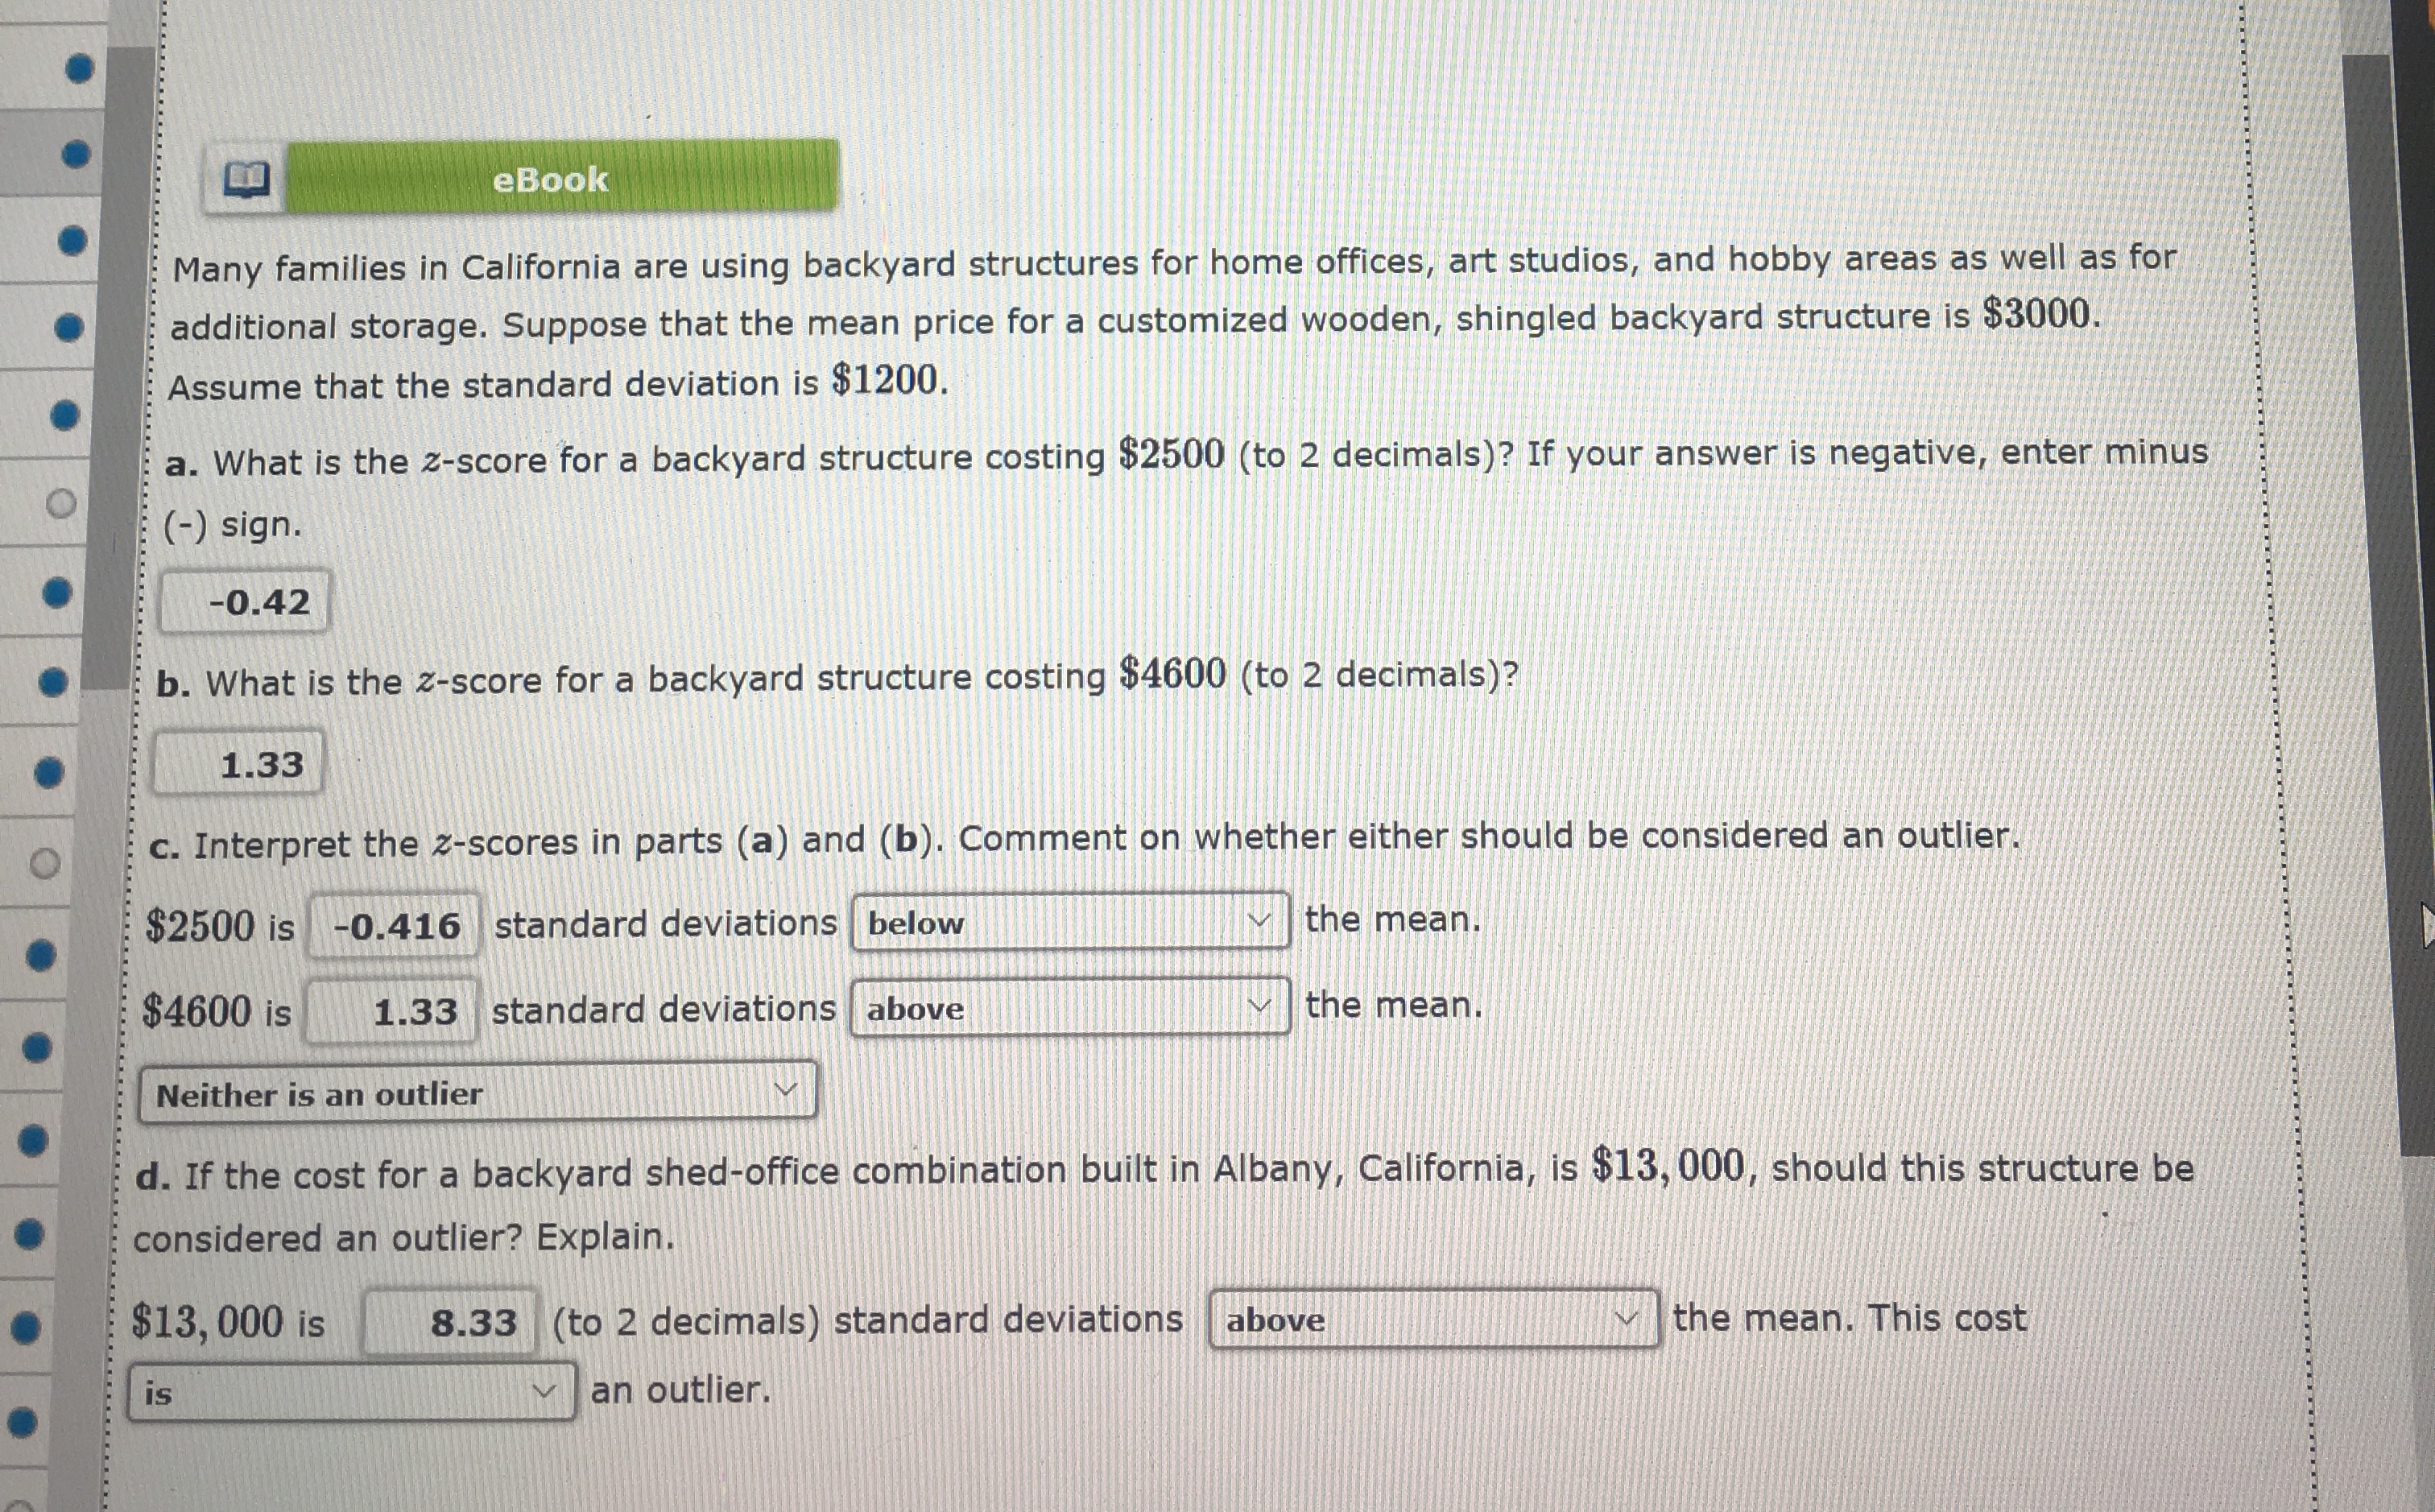
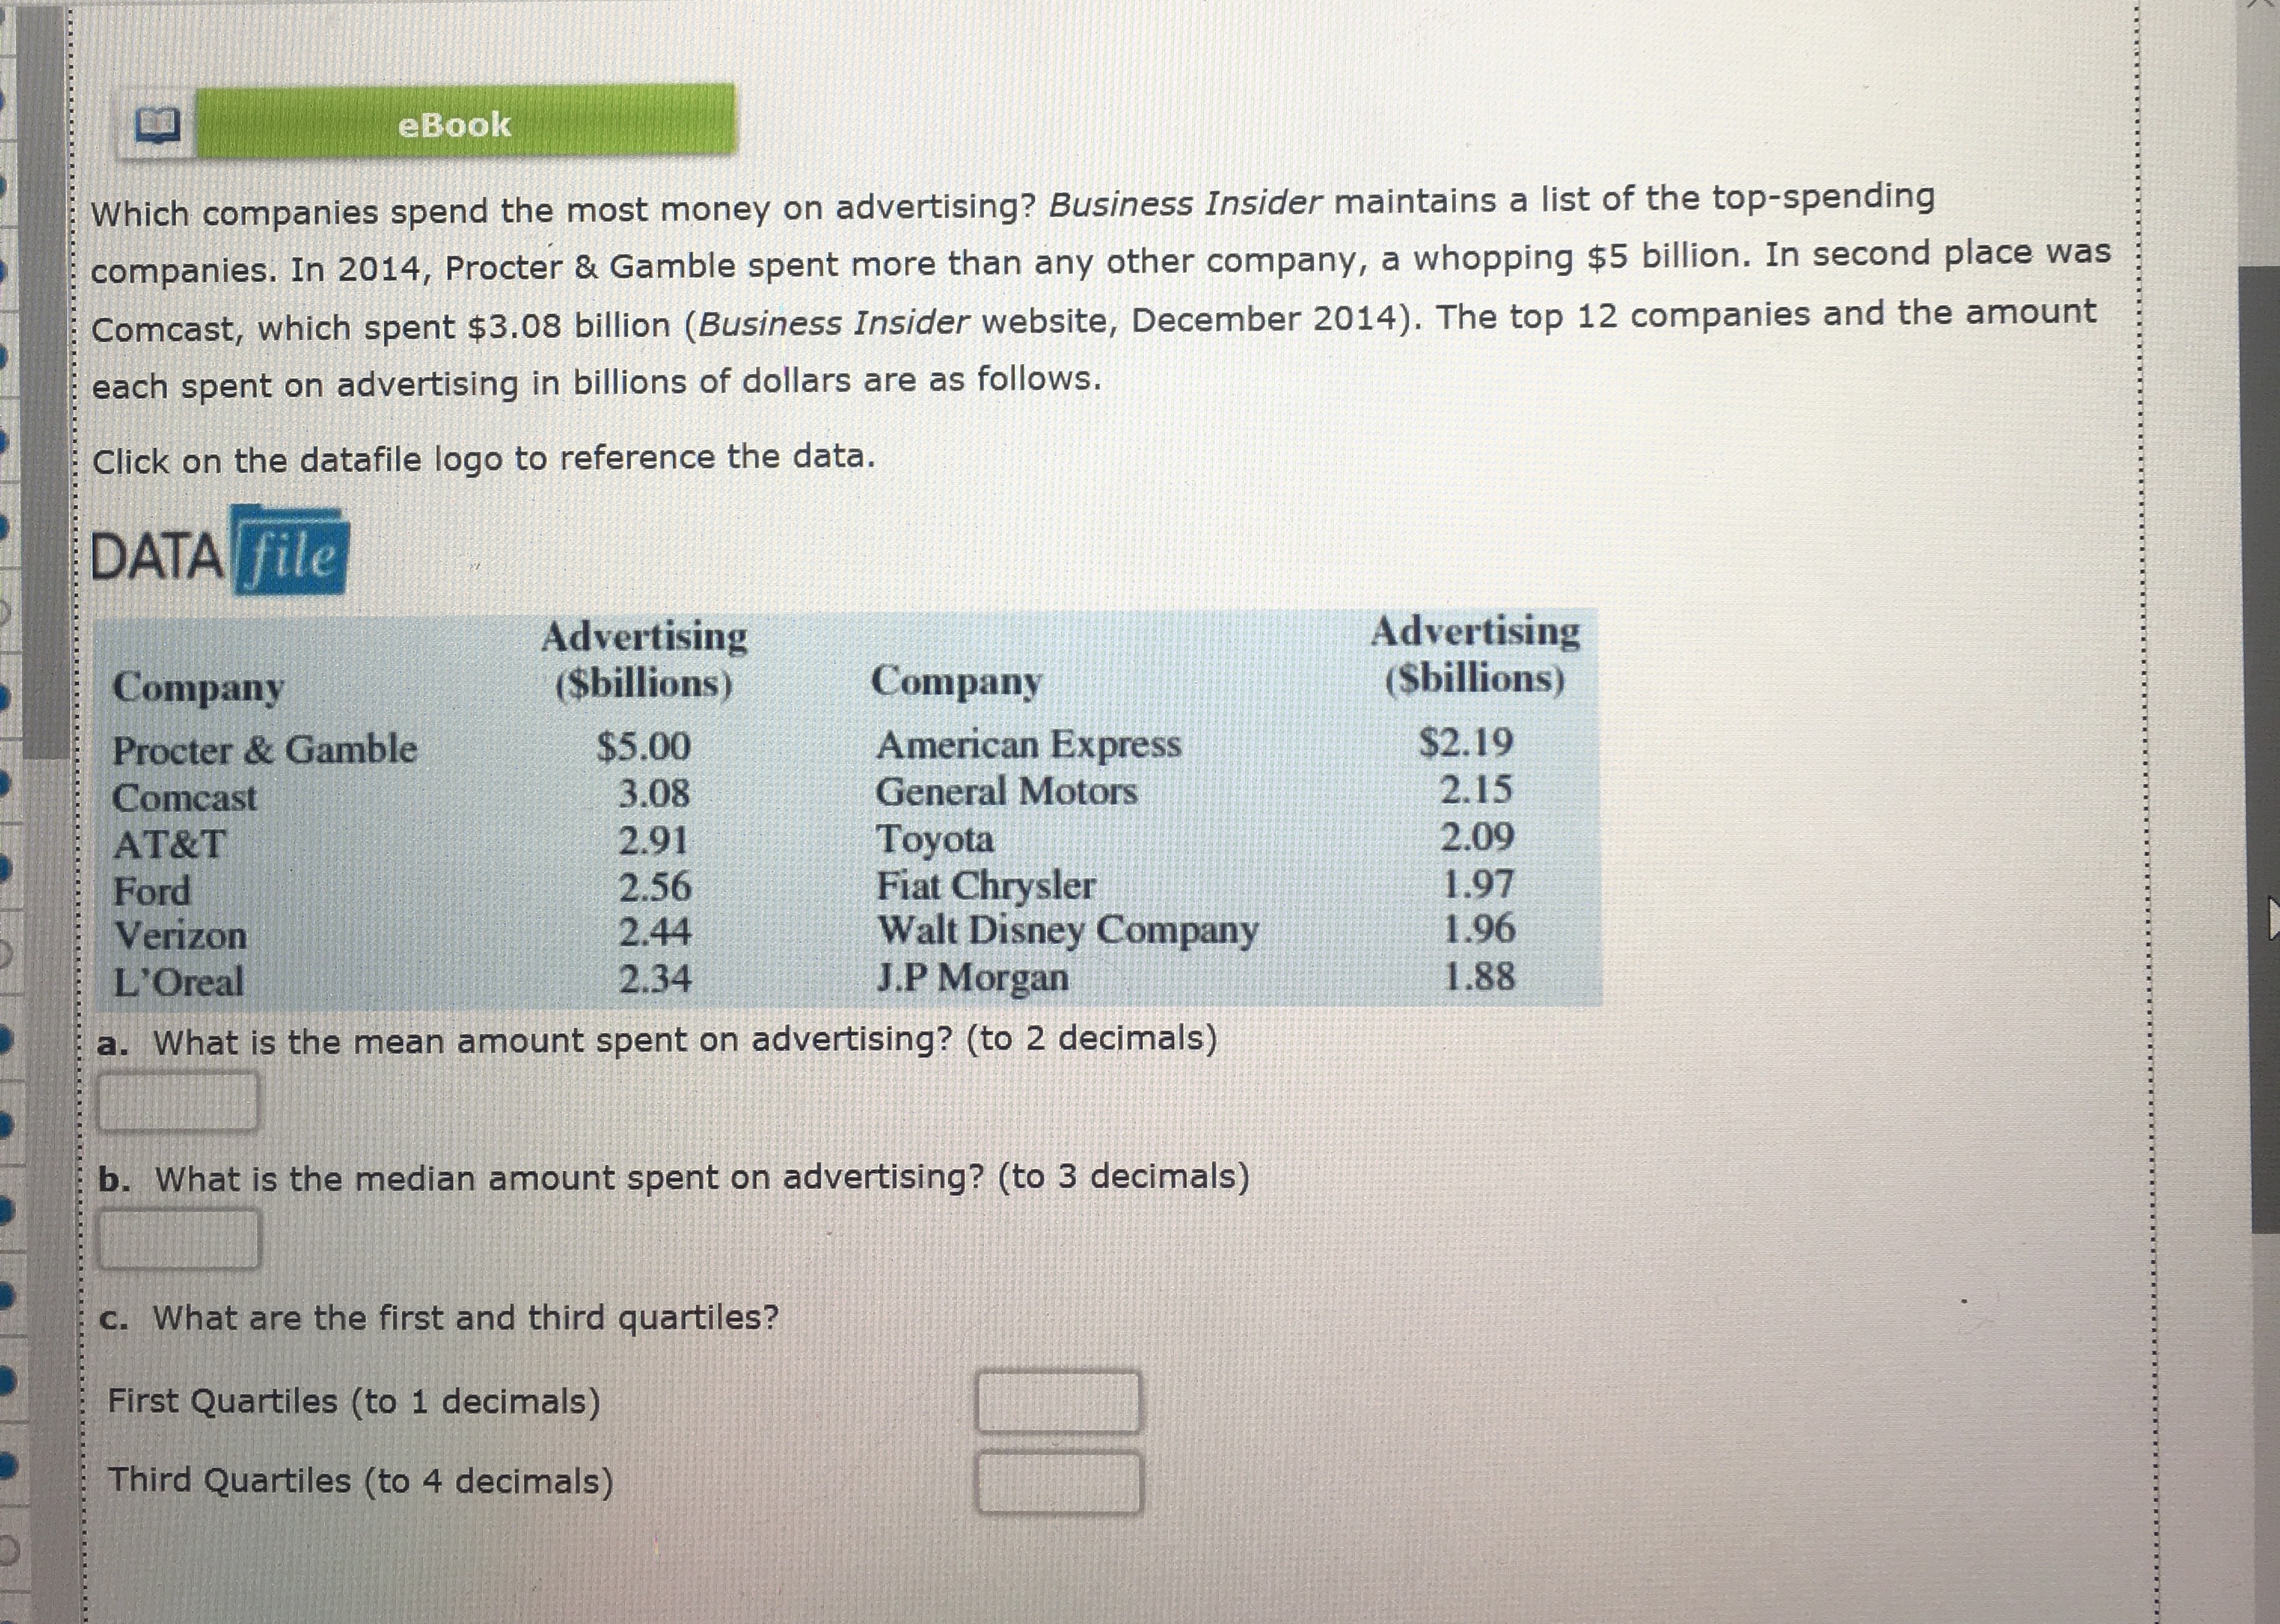
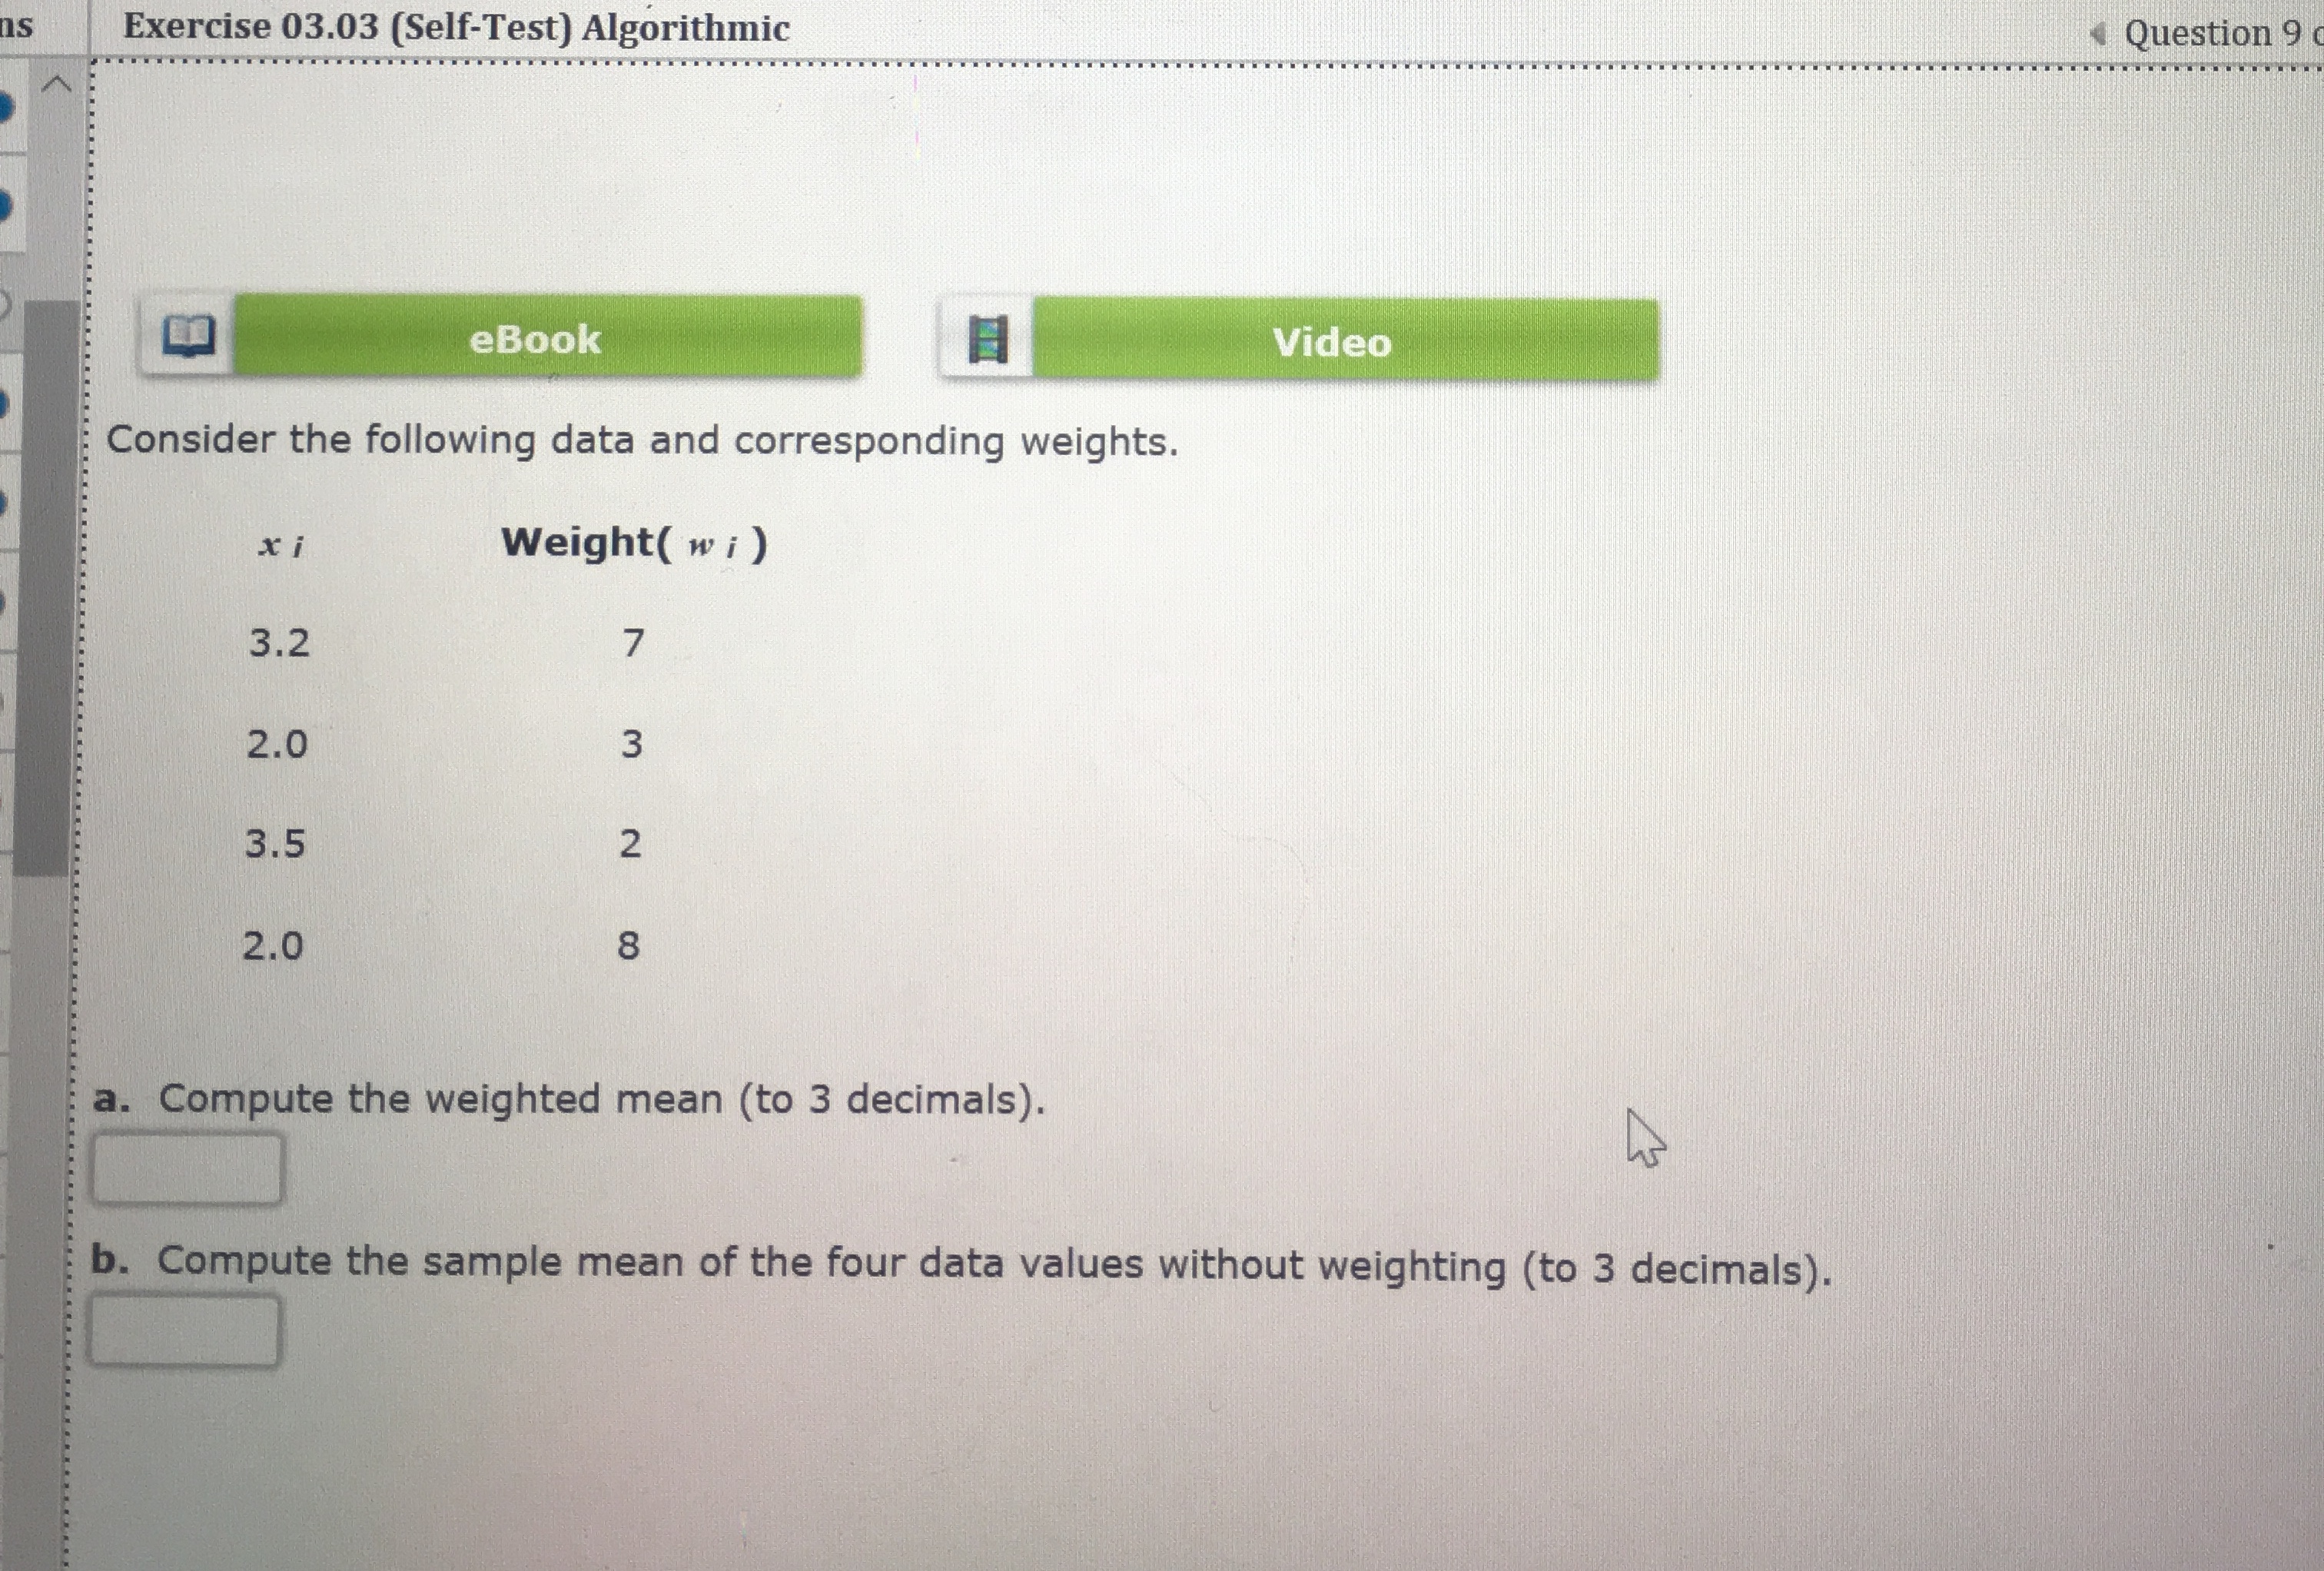
Exercise 03.38 Algorithmic Question 3 of 23 eBook Suppose the data have a bell-shaped distribution with a mean of 50 and a standard deviation of 7. Use the empirical rule to determine the percentage of data within of the following range: 36 to 64 - Select your answer - 29 to 71 - Select your answer 43 to 57 - Select your answer - gnmentMain.do?takeAssignmentSessionLocatoeBook Many families in California are using backyard structures for home offices, art studios, and hobby areas as well as for additional storage. Suppose that the mean price for a customized wooden, shingled backyard structure is $3000. Assume that the standard deviation is $1200. a. What is the z-score for a backyard structure costing $2500 (to 2 decimals)? If your answer is negative, enter minus (-) sign. -0.42 b. What is the z-score for a backyard structure costing $4600 (to 2 decimals)? 1.33 c. Interpret the z-scores in parts (a) and (b). Comment on whether either should be considered an outlier. $2500 is -0.416 standard deviations below the mean. $4600 is 1.33 standard deviations above the mean. Neither is an outlier d. If the cost for a backyard shed-office combination built in Albany, California, is $13, 000, should this structure be considered an outlier? Explain. $13, 000 is 8.33 (to 2 decimals) standard deviations above the mean. This cost is an outlier.eBook Which companies spend the most money on advertising? Business Insider maintains a list of the top-spending companies. In 2014, Procter & Gamble spent more than any other company, a whopping $5 billion. In second place was Comcast, which spent $3.08 billion (Business Insider website, December 2014). The top 12 companies and the amount each spent on advertising in billions of dollars are as follows. Click on the datafile logo to reference the data. DATA file Advertising Advertising Company ($billions) Company ($billions) Procter & Gamble $5.00 American Express $2.19 Comcast 3.08 General Motors 2.15 AT&T 2.91 Toyota 2.09 Ford 2.56 Fiat Chrysler 1.97 Verizon 2.44 Walt Disney Company 1.96 L'Oreal 2.34 J.P Morgan 1.88 a. What is the mean amount spent on advertising? (to 2 decimals) What is the median amount spent on advertising? (to 3 decimals) c. What are the first and third quartiles? First Quartiles (to 1 decimals) Third Quartiles (to 4 decimals)Exercise 03.03 (Self-Test) Algorithmic Question 9 eBook Video Consider the following data and corresponding weights. xi Weight( wi ) 3.2 2.0 3 3.5 2 2.0 8 a. Compute the weighted mean (to 3 decimals). b. Compute the sample mean of the four data values without weighting (to 3 decimals)
Step by Step Solution
There are 3 Steps involved in it

Get step-by-step solutions from verified subject matter experts