

Question: Statistics and Probability Here is a bivariate data set in which you believe y to be the response variable. X y 58.4 6.1 71.7 35.2
Statistics and Probability
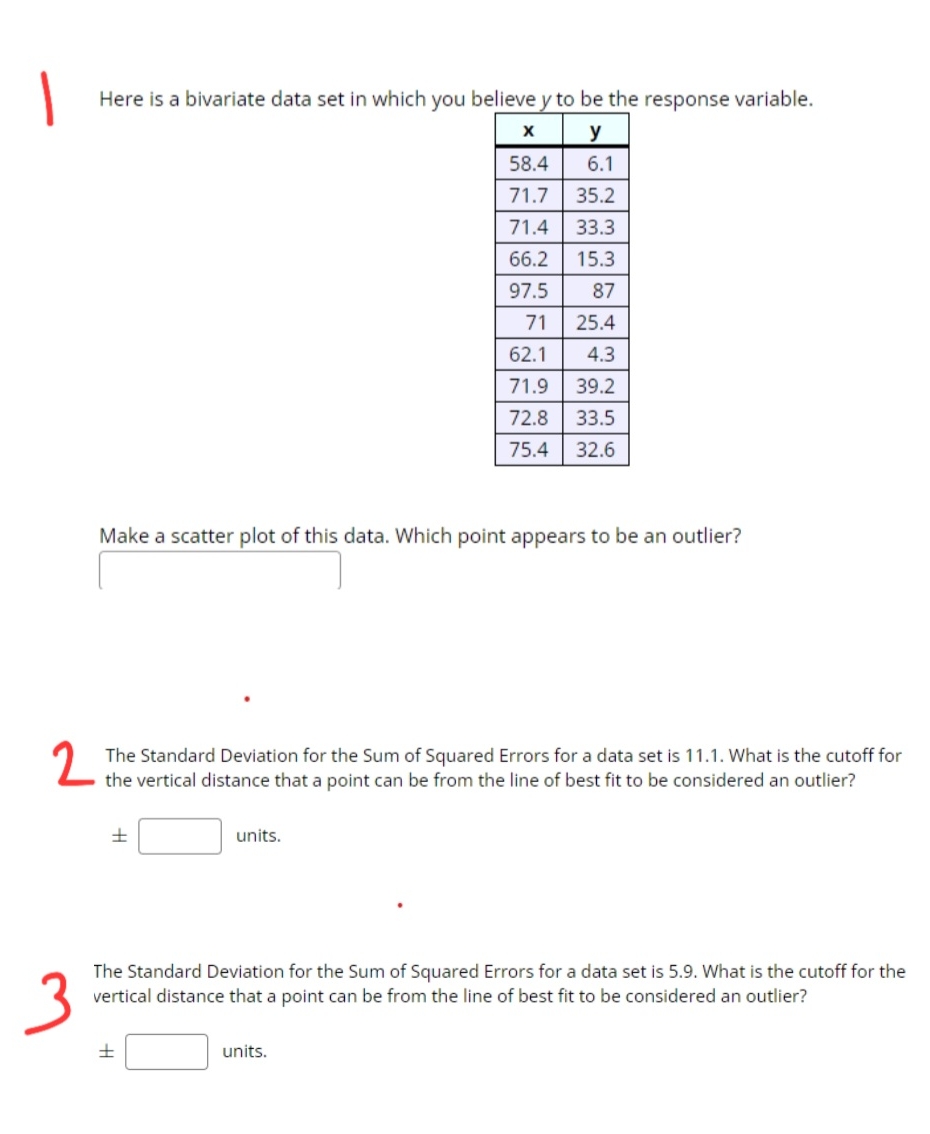
Here is a bivariate data set in which you believe y to be the response variable. X y 58.4 6.1 71.7 35.2 71.4 33.3 66.2 15.3 97.5 87 71 25.4 62.1 4.3 71.9 39.2 72.8 33.5 75.4 32.6 Make a scatter plot of this data. Which point appears to be an outlier? 2 The Standard Deviation for the Sum of Squared Errors for a data set is 11.1. What is the cutoff for the vertical distance that a point can be from the line of best fit to be considered an outlier? F units. The Standard Deviation for the Sum of Squared Errors for a data set is 5.9. What is the cutoff for the N vertical distance that a point can be from the line of best fit to be considered an outlier? F units
Step by Step Solution
There are 3 Steps involved in it

Get step-by-step solutions from verified subject matter experts