

Question: STATISTICS AND PROBABILITY HI. CORRELATION AND REGRESSION ANALYSIS Directions: Read and analyze the problem carefully. Use a separate SHORT BOND PAPER for your answers. Given


STATISTICS AND PROBABILITY
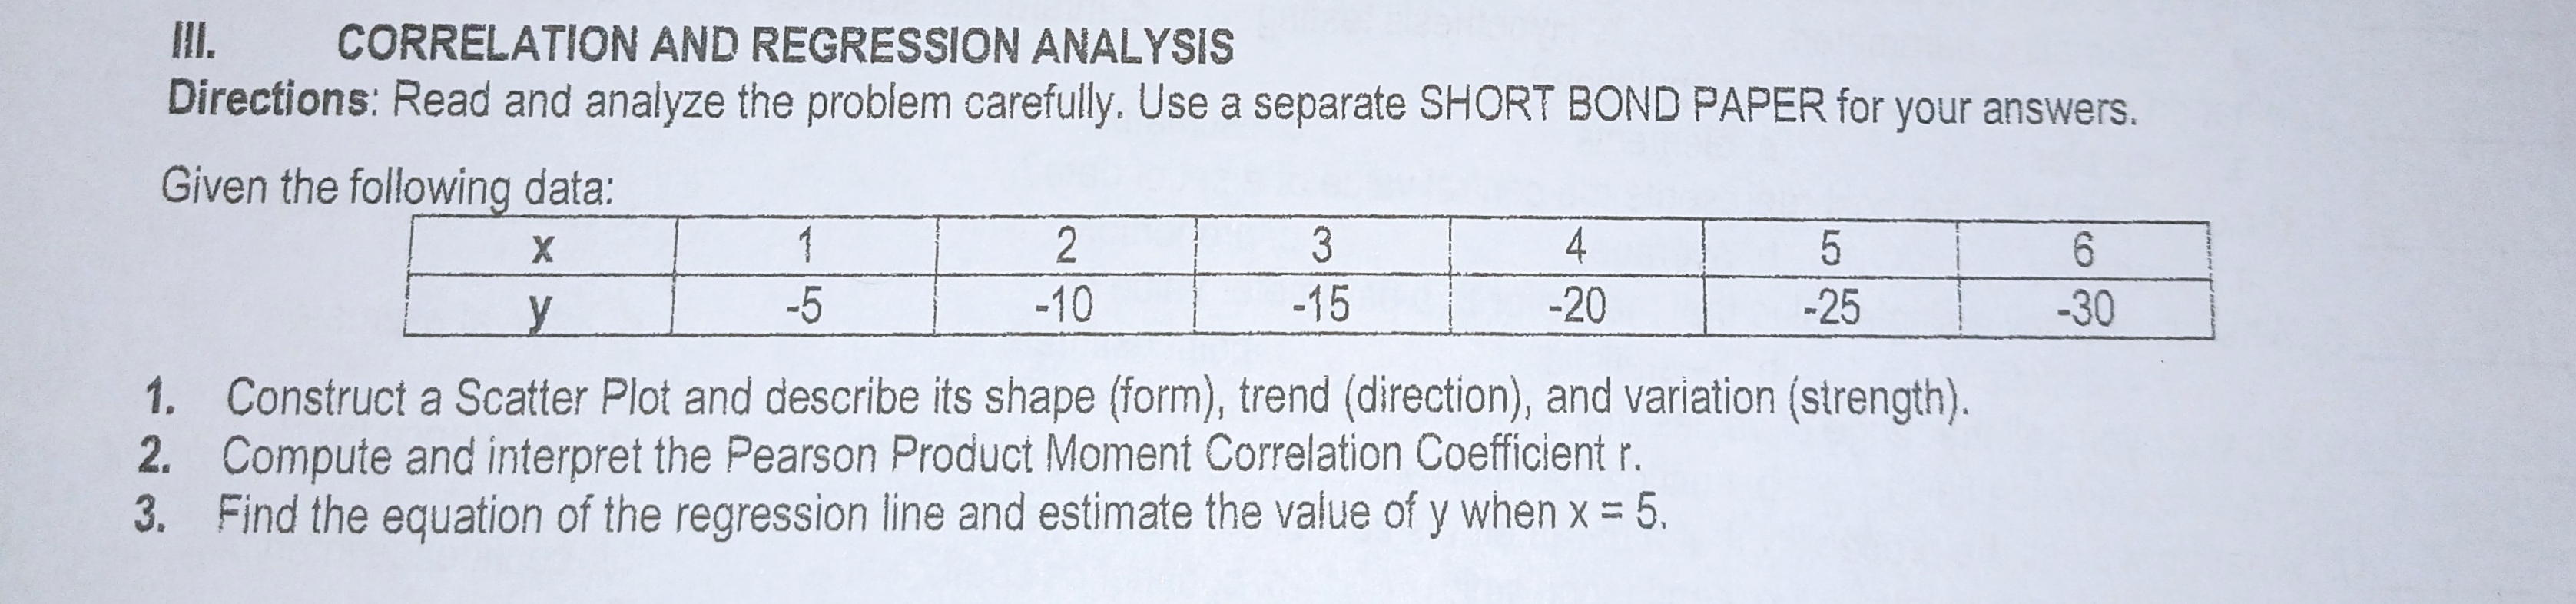
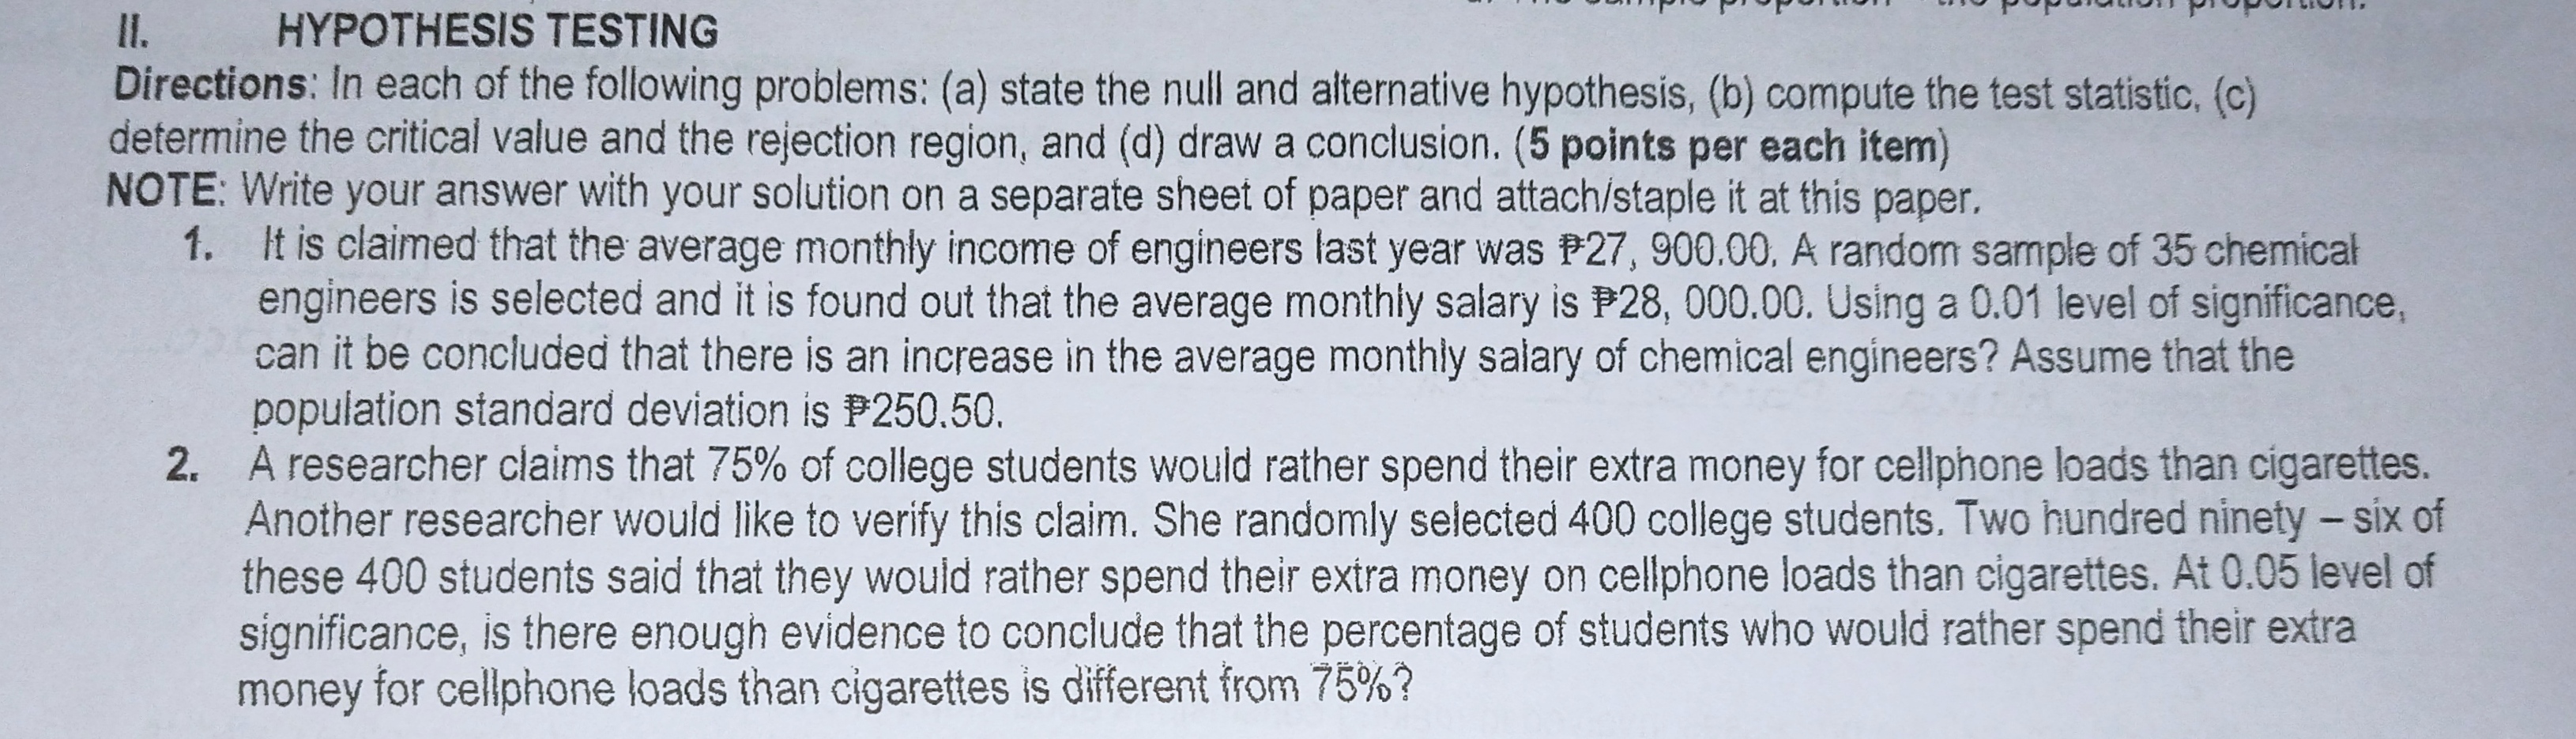
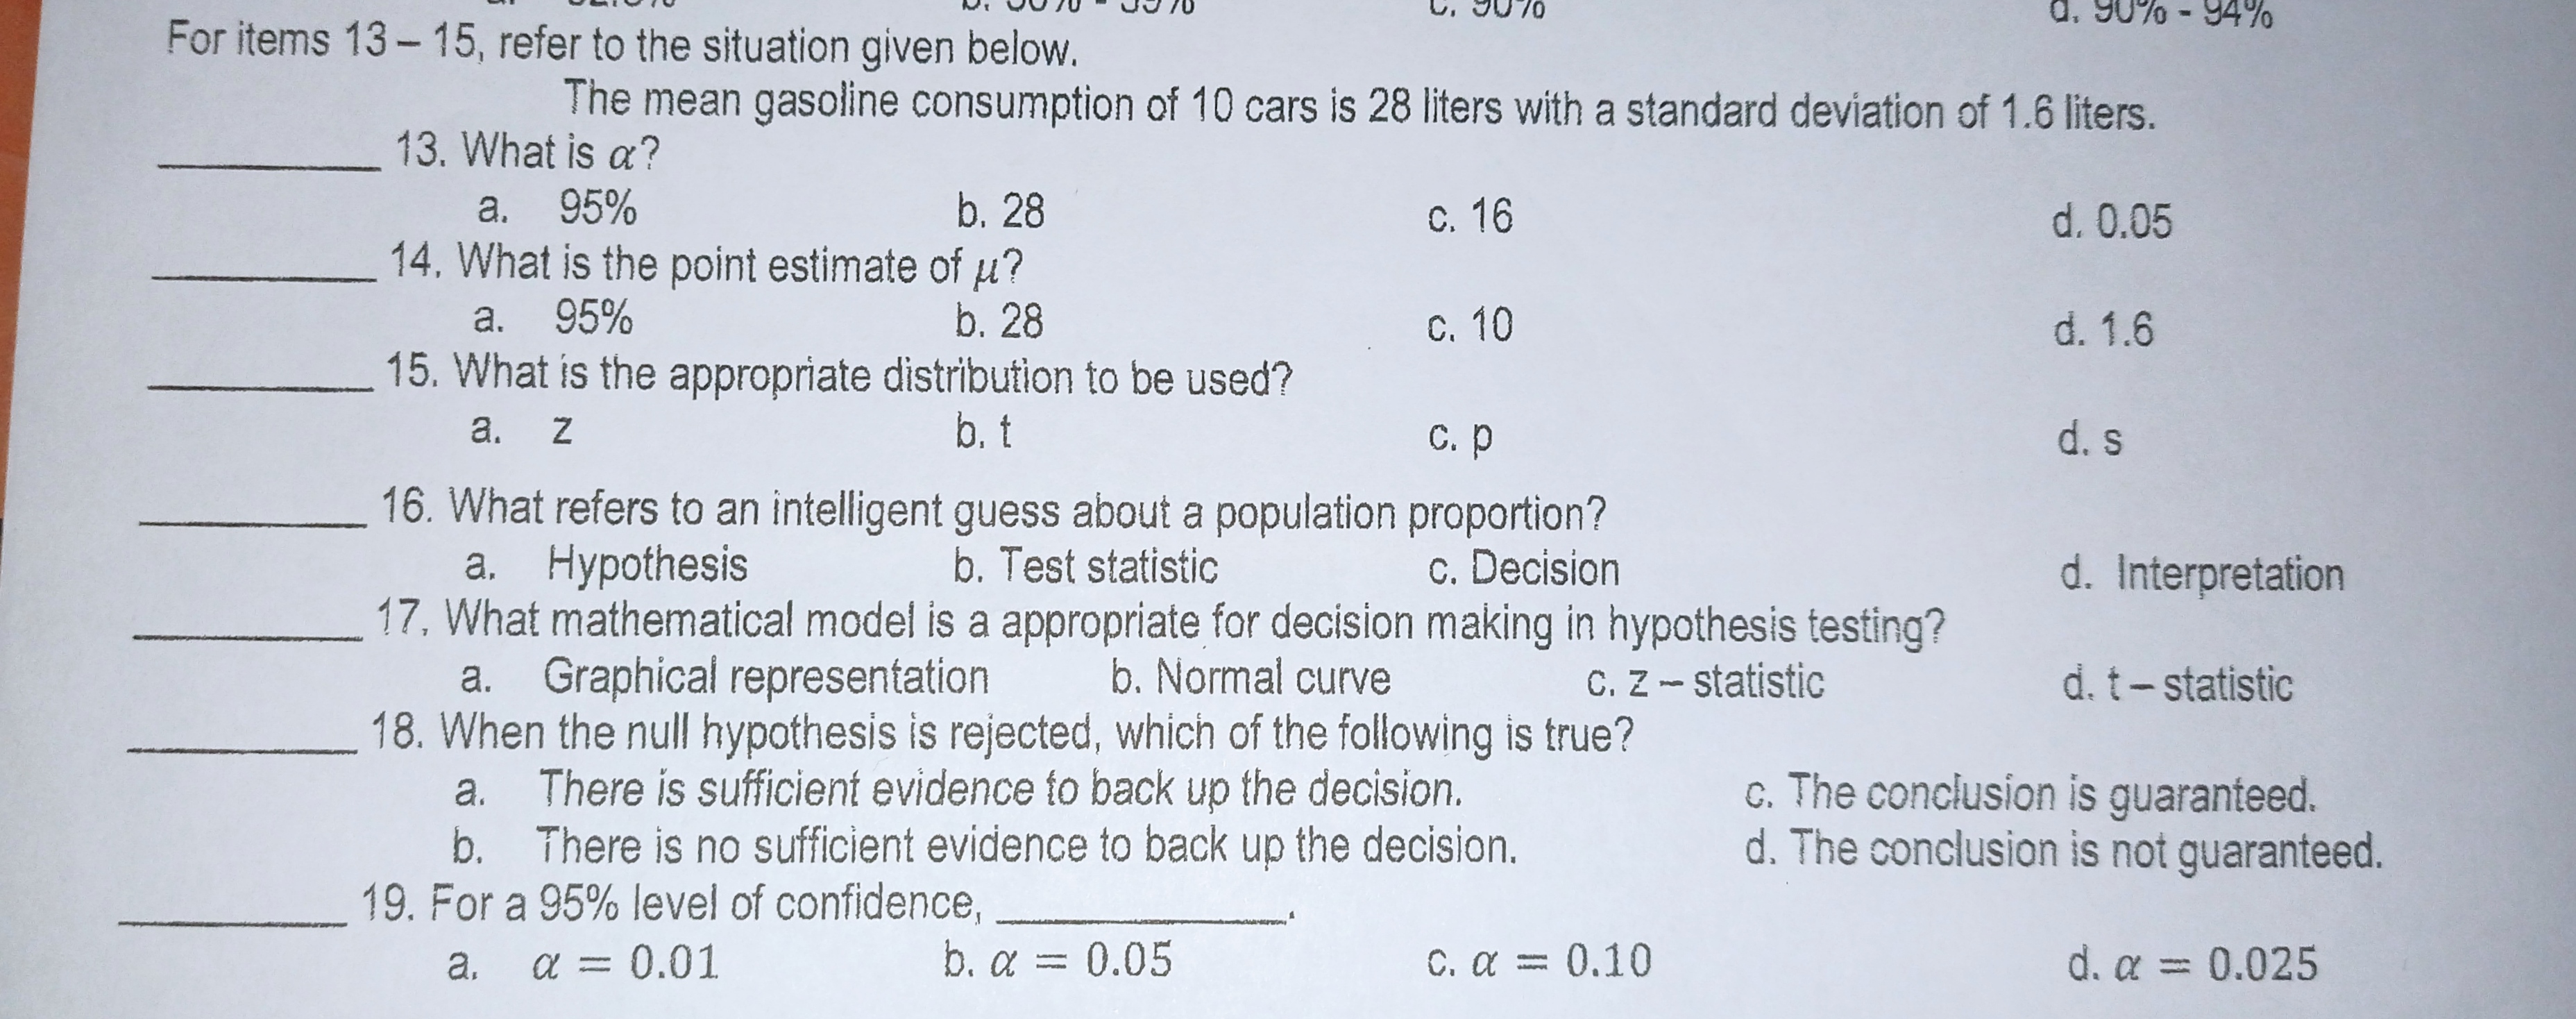
HI. CORRELATION AND REGRESSION ANALYSIS Directions: Read and analyze the problem carefully. Use a separate SHORT BOND PAPER for your answers. Given the following data: X 2 4 5 6 -5 -10 -15 -20 -25 -30 1. Construct a Scatter Plot and describe its shape (form), trend (direction), and variation (strength). 2. Compute and interpret the Pearson Product Moment Correlation Coefficient r. 3. Find the equation of the regression line and estimate the value of y when x = 5.HYPOTHESIS TESTING Directions: In each of the following problems: (a) state the null and alternative hypothesis, (b) compute the test statistic, (c) determine the critical value and the rejection region, and (d) draw a conclusion. (5 points per each item) NOTE: Write your answer with your solution on a separate sheet of paper and attach/staple it at this paper. 1. It is claimed that the average monthly income of engineers last year was P27, 900.00, A random sample of 35 chemical engineers is selected and it is found out that the average monthly salary is P28, 000.00. Using a 0.01 level of significance, can it be concluded that there is an increase in the average monthly salary of chemical engineers? Assume that the population standard deviation is P250.50. 2. A researcher claims that 75% of college students would rather spend their extra money for cellphone loads than cigarettes. Another researcher would like to verify this claim. She randomly selected 400 college students. Two hundred ninety - six of these 400 students said that they would rather spend their extra money on cellphone loads than cigarettes. At 0.05 level of significance, is there enough evidence to conclude that the percentage of students who would rather spend their extra money for cellphone loads than cigarettes is different from 75%?, 3070 - 94% For items 13 - 15, refer to the situation given below. The mean gasoline consumption of 10 cars is 28 liters with a standard deviation of 1.6 liters. 13. What is a? a. 95% b. 28 C. 16 d. 0.05 14. What is the point estimate of u? a. 95% b. 28 C. 10 d. 1.6 15. What is the appropriate distribution to be used? a. Z b, t c. p d. s 16. What refers to an intelligent guess about a population proportion? a. Hypothesis b. Test statistic c. Decision d. Interpretation 17, What mathematical model is a appropriate for decision making in hypothesis testing? a. Graphical representation b. Normal curve c. Z - statistic d. t - statistic 18. When the null hypothesis is rejected, which of the following is true? a. There is sufficient evidence to back up the decision. c. The conclusion is guaranteed. b. There is no sufficient evidence to back up the decision. d. The conclusion is not guaranteed. 19. For a 95% level of confidence, a. a = 0.01 b. a = 0.05 C. a = 0.10 d. a = 0.025
Step by Step Solution
There are 3 Steps involved in it

Get step-by-step solutions from verified subject matter experts