

Question: Statistics and Probability Kara categorized her spending for this month into four categories: Rent, Food, Fun, and Other. The amounts she spent in each category
Statistics and Probability
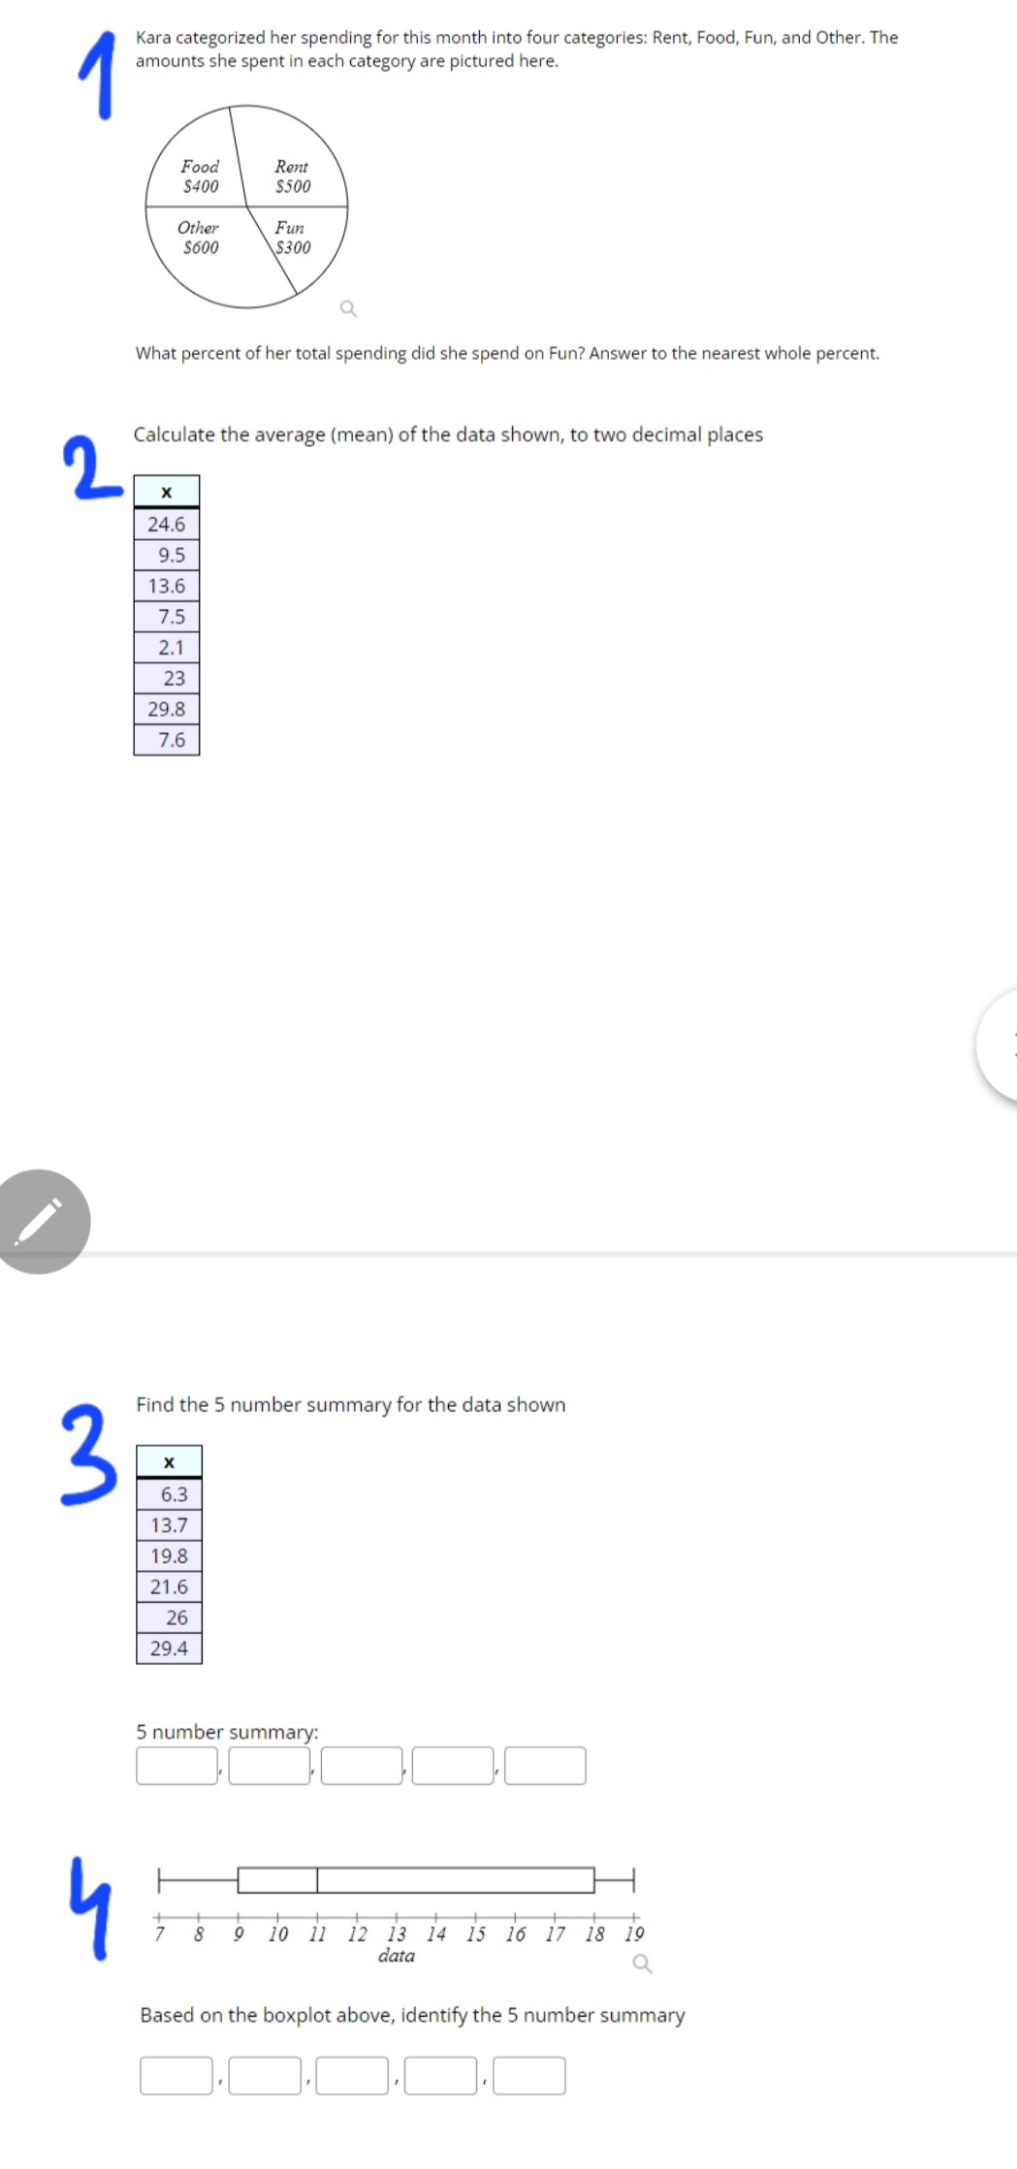
Kara categorized her spending for this month into four categories: Rent, Food, Fun, and Other. The amounts she spent in each category are pictured here. Food Rent $400 $500 Other Fun $600 $300 Q What percent of her total spending did she spend on Fun? Answer to the nearest whole percent. Calculate the average (mean) of the data shown, to two decimal places 2 X 24.6 9.5 13.6 7.5 2.1 23 29.8 7.6 Find the 5 number summary for the data shown W X 6.3 13.7 19.8 21.6 26 29.4 5 number summary: 8 9 10 11 12 13 14 15 16 17 18 19 data Q Based on the boxplot above, identify the 5 number summary
Step by Step Solution
There are 3 Steps involved in it
1 Expert Approved Answer
Step: 1 Unlock

Question Has Been Solved by an Expert!
Get step-by-step solutions from verified subject matter experts
Step: 2 Unlock
Step: 3 Unlock