

Question: Statistics and Probability Run a regression analysis on the following bivariate set of data with y as the response variable. X y 51.4 25.4 57.9
Statistics and Probability
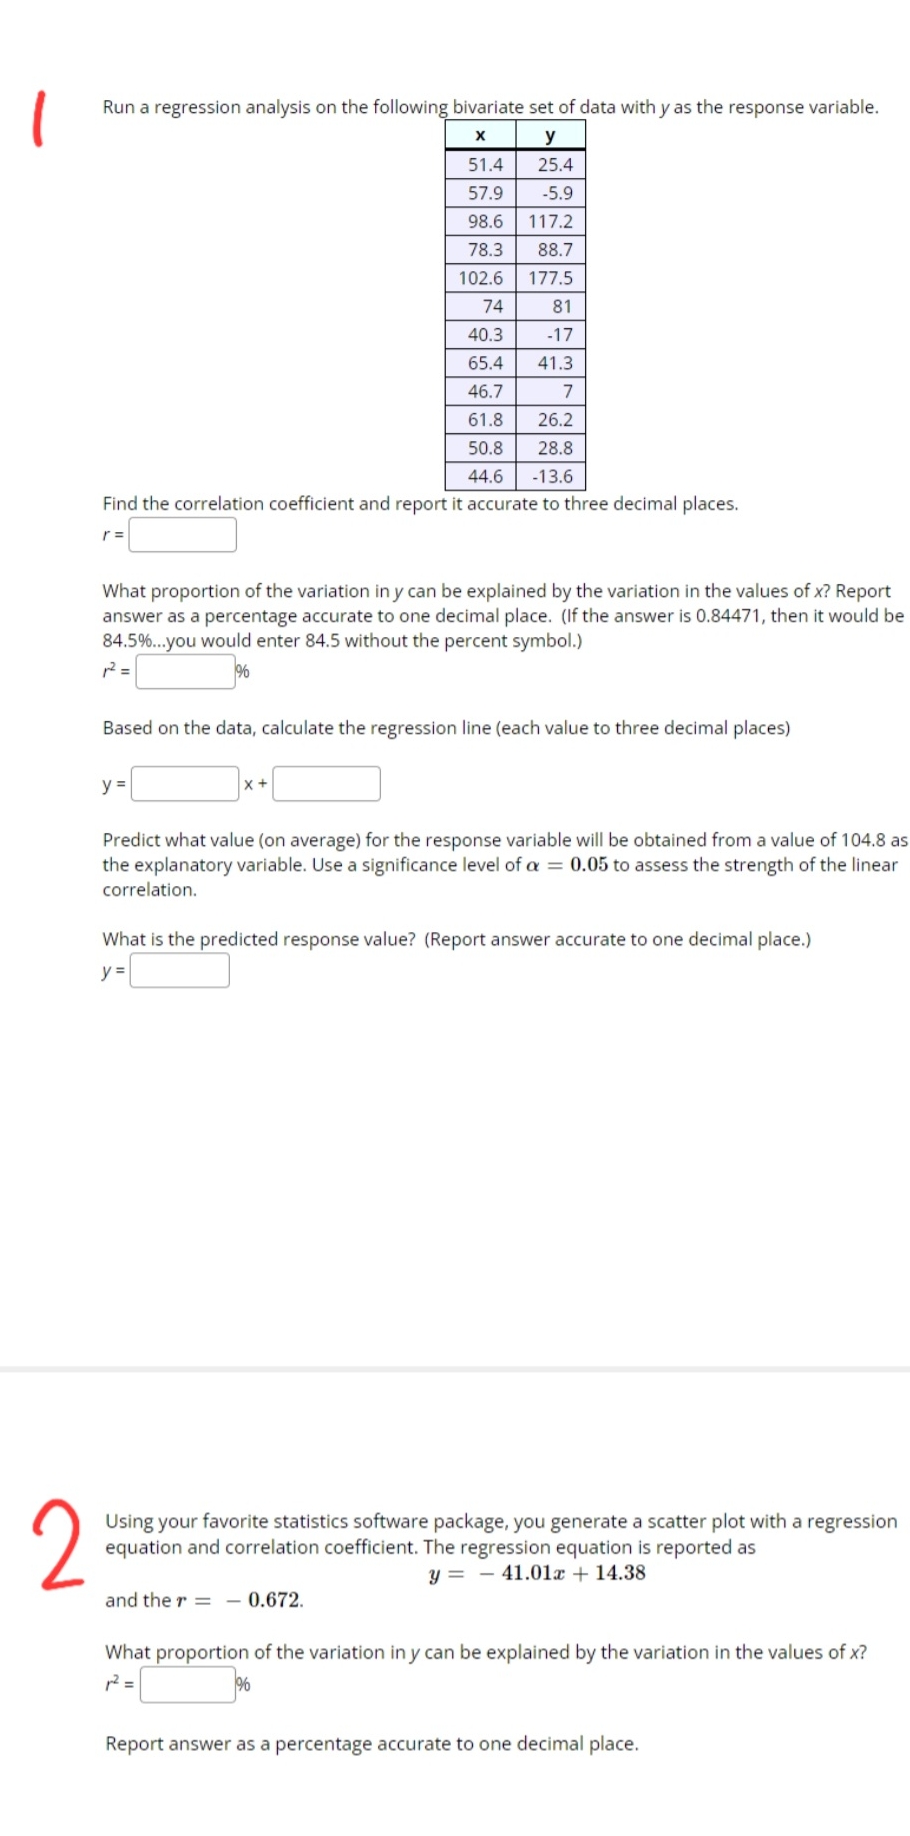
Run a regression analysis on the following bivariate set of data with y as the response variable. X y 51.4 25.4 57.9 -5.9 98.6 117.2 78.3 88.7 102.6 177.5 74 81 40.3 -17 65.4 41.3 46.7 7 61.8 26.2 50.8 28.8 44.6 -13.6 Find the correlation coefficient and report it accurate to three decimal places. r = What proportion of the variation in y can be explained by the variation in the values of x? Report answer as a percentage accurate to one decimal place. (If the answer is 0.84471, then it would be 84.5%...you would enter 84.5 without the percent symbol.) 12 = Based on the data, calculate the regression line (each value to three decimal places) y = Predict what value (on average) for the response variable will be obtained from a value of 104.8 as the explanatory variable. Use a significance level of a = 0.05 to assess the strength of the linear correlation. What is the predicted response value? (Report answer accurate to one decimal place.) y = Using your favorite statistics software package, you generate a scatter plot with a regression N equation and correlation coefficient. The regression equation is reported as y = - 41.01x + 14.38 and the r = - 0.672. What proportion of the variation in y can be explained by the variation in the values of x? 12 = Report answer as a percentage accurate to one decimal place
Step by Step Solution
There are 3 Steps involved in it

Get step-by-step solutions from verified subject matter experts