

Question: Statistics and Probability The boxplot below shows salaries for Actuaries and CPAs. CPA Actuary 30 40 50 60 70 80 90 Salary (thousands of $)
Statistics and Probability

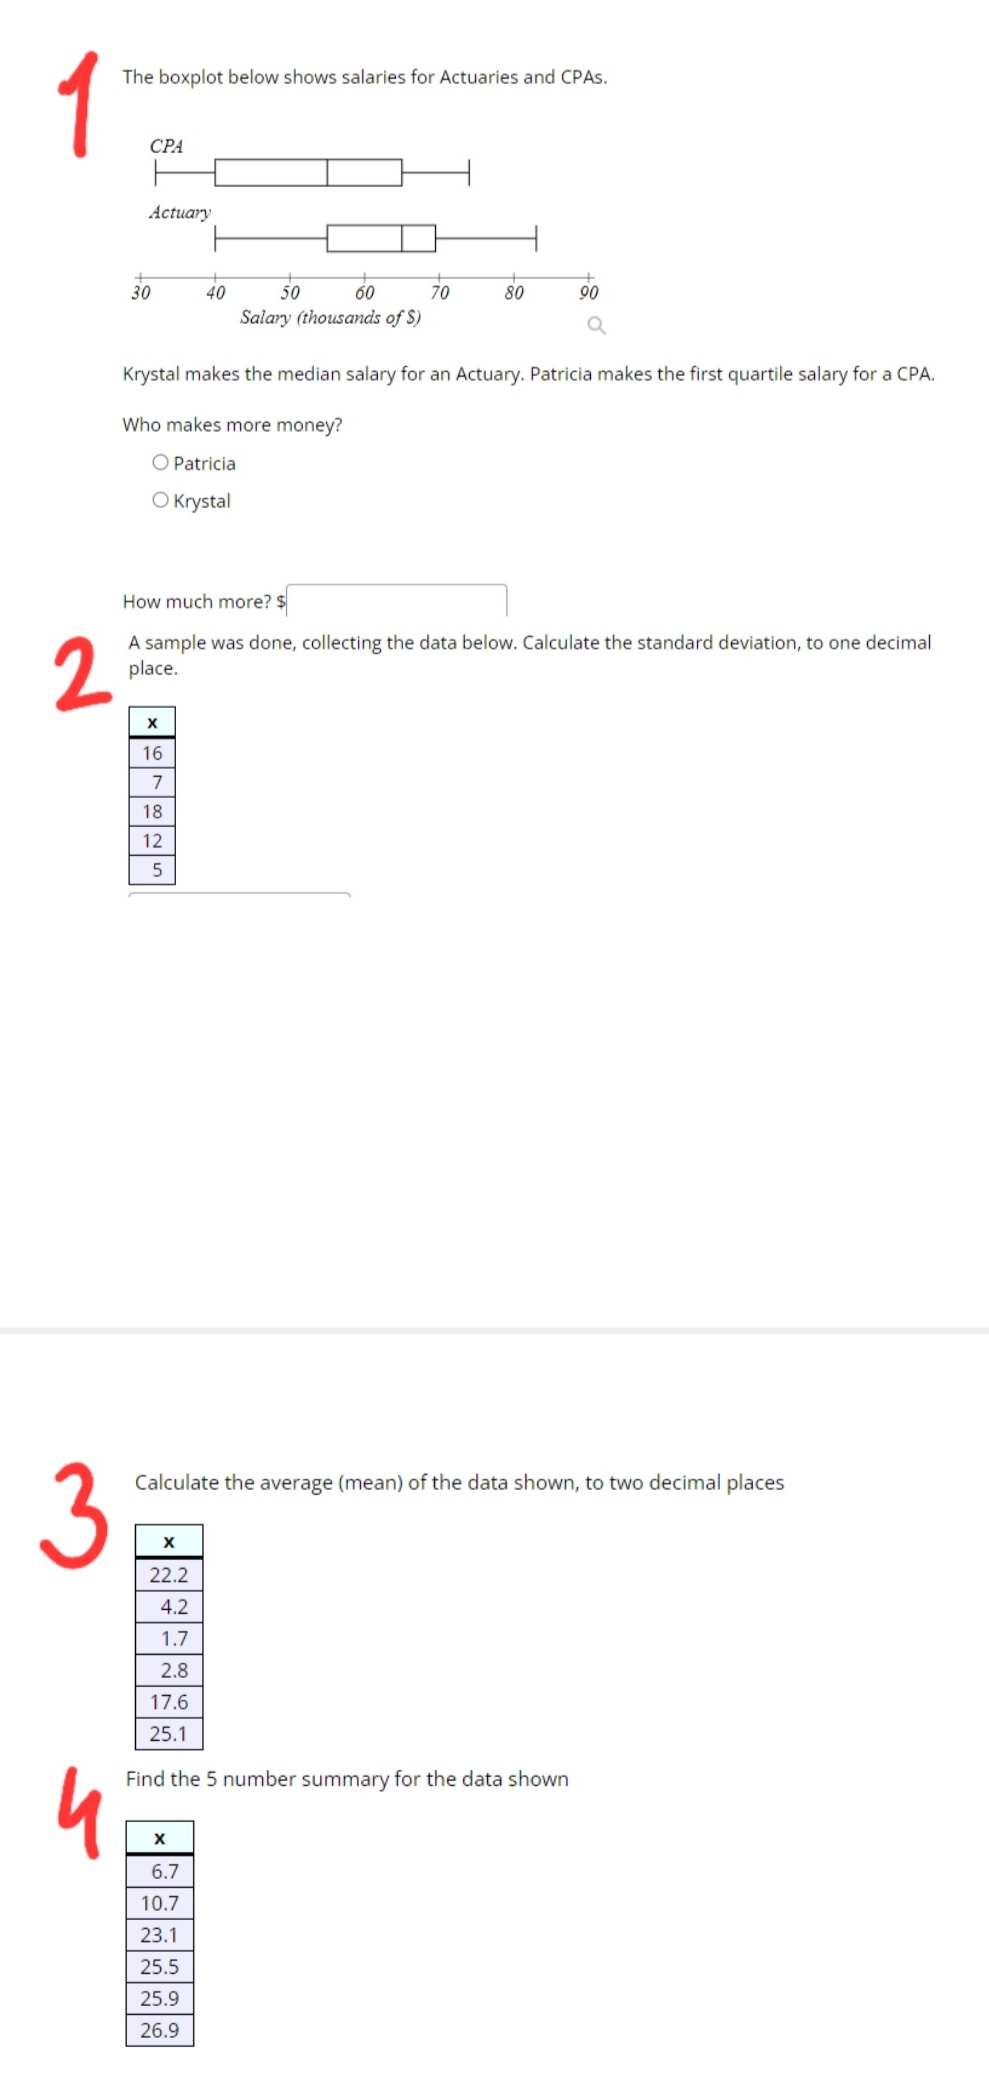
The boxplot below shows salaries for Actuaries and CPAs. CPA Actuary 30 40 50 60 70 80 90 Salary (thousands of $) Q Krystal makes the median salary for an Actuary. Patricia makes the first quartile salary for a CPA. Who makes more money? O Patricia O Krystal How much more? $ 2 A sample was done, collecting the data below. Calculate the standard deviation, to one decimal place. X 16 7 18 12 5 Calculate the average (mean) of the data shown, to two decimal places X 22.2 4.2 1.7 2.8 17.6 25.1 Find the 5 number summary for the data shown X 6.7 10.7 23.1 25.5 25.9 26.9
Step by Step Solution
There are 3 Steps involved in it
1 Expert Approved Answer
Step: 1 Unlock

Question Has Been Solved by an Expert!
Get step-by-step solutions from verified subject matter experts
Step: 2 Unlock
Step: 3 Unlock