

Question: Statistics and Probability The time spent studying for a test and the test scores are graphed below along with the best-fit line. e = 1.04
Statistics and Probability
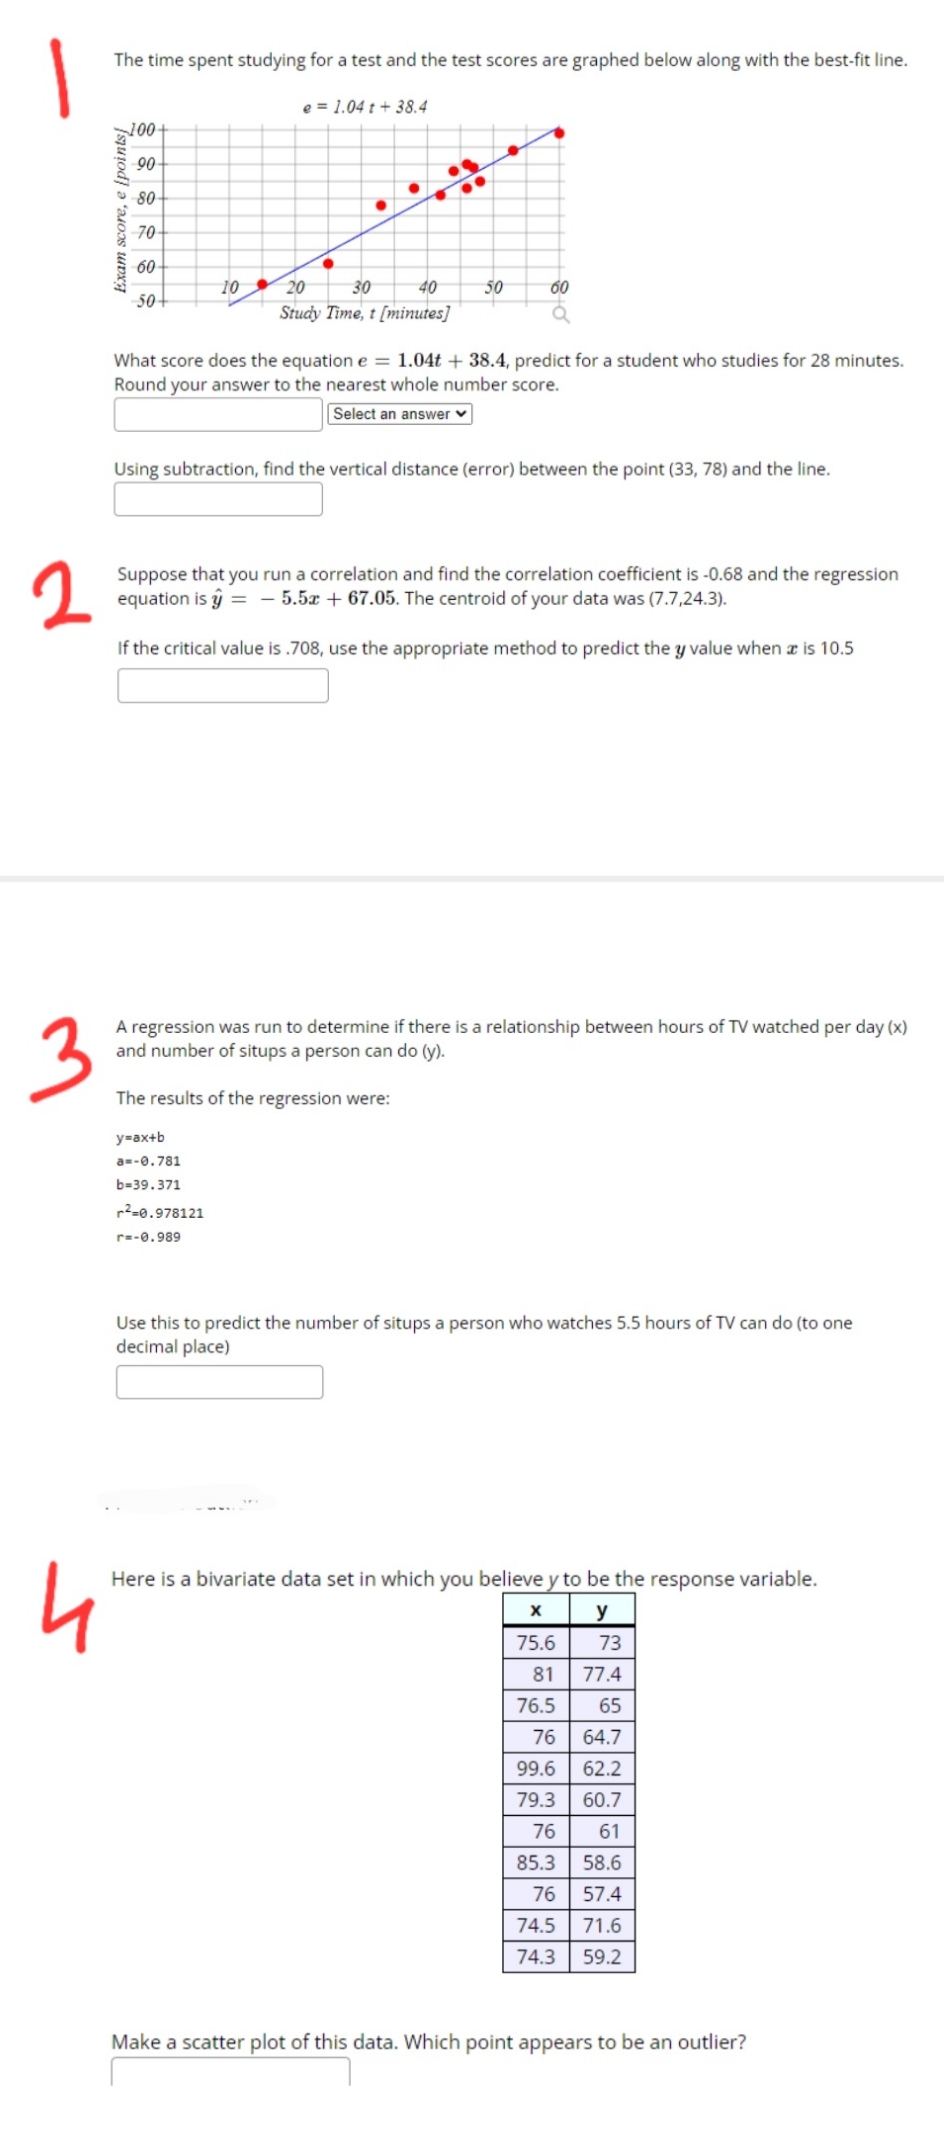
The time spent studying for a test and the test scores are graphed below along with the best-fit line. e = 1.04 t + 38.4 100- 90 -80 Exam score, e (points 70- 60- 10 20 30 40 50 50 60 Study Time, t [minutes] a What score does the equation e = 1.04t + 38.4, predict for a student who studies for 28 minutes. Round your answer to the nearest whole number score. Select an answer v Using subtraction, find the vertical distance (error) between the point (33, 78) and the line. 2 Suppose that you run a correlation and find the correlation coefficient is -0.68 and the regression equation is y = - 5.5x + 67.05. The centroid of your data was (7.7,24.3). If the critical value is .708, use the appropriate method to predict the y value when a is 10.5 3 A regression was run to determine if there is a relationship between hours of TV watched per day (x) and number of situps a person can do (y). The results of the regression were: y=ax+b a=-0.781 b=39.371 2-0.978121 r=-0.989 Use this to predict the number of situps a person who watches 5.5 hours of TV can do (to one decimal place) Here is a bivariate data set in which you believe y to be the response variable. L X y 75.6 73 81 77.4 76.5 65 76 64.7 99.6 62.2 79.3 60.7 76 61 85.3 58.6 76 57.4 74.5 71.6 74.3 59.2 Make a scatter plot of this data. Which point appears to be an outlier
Step by Step Solution
There are 3 Steps involved in it

Get step-by-step solutions from verified subject matter experts