

Question: Statistics B. 6. The following frequency table is the number of days students missed class out of 24 classes in Class A and Class #
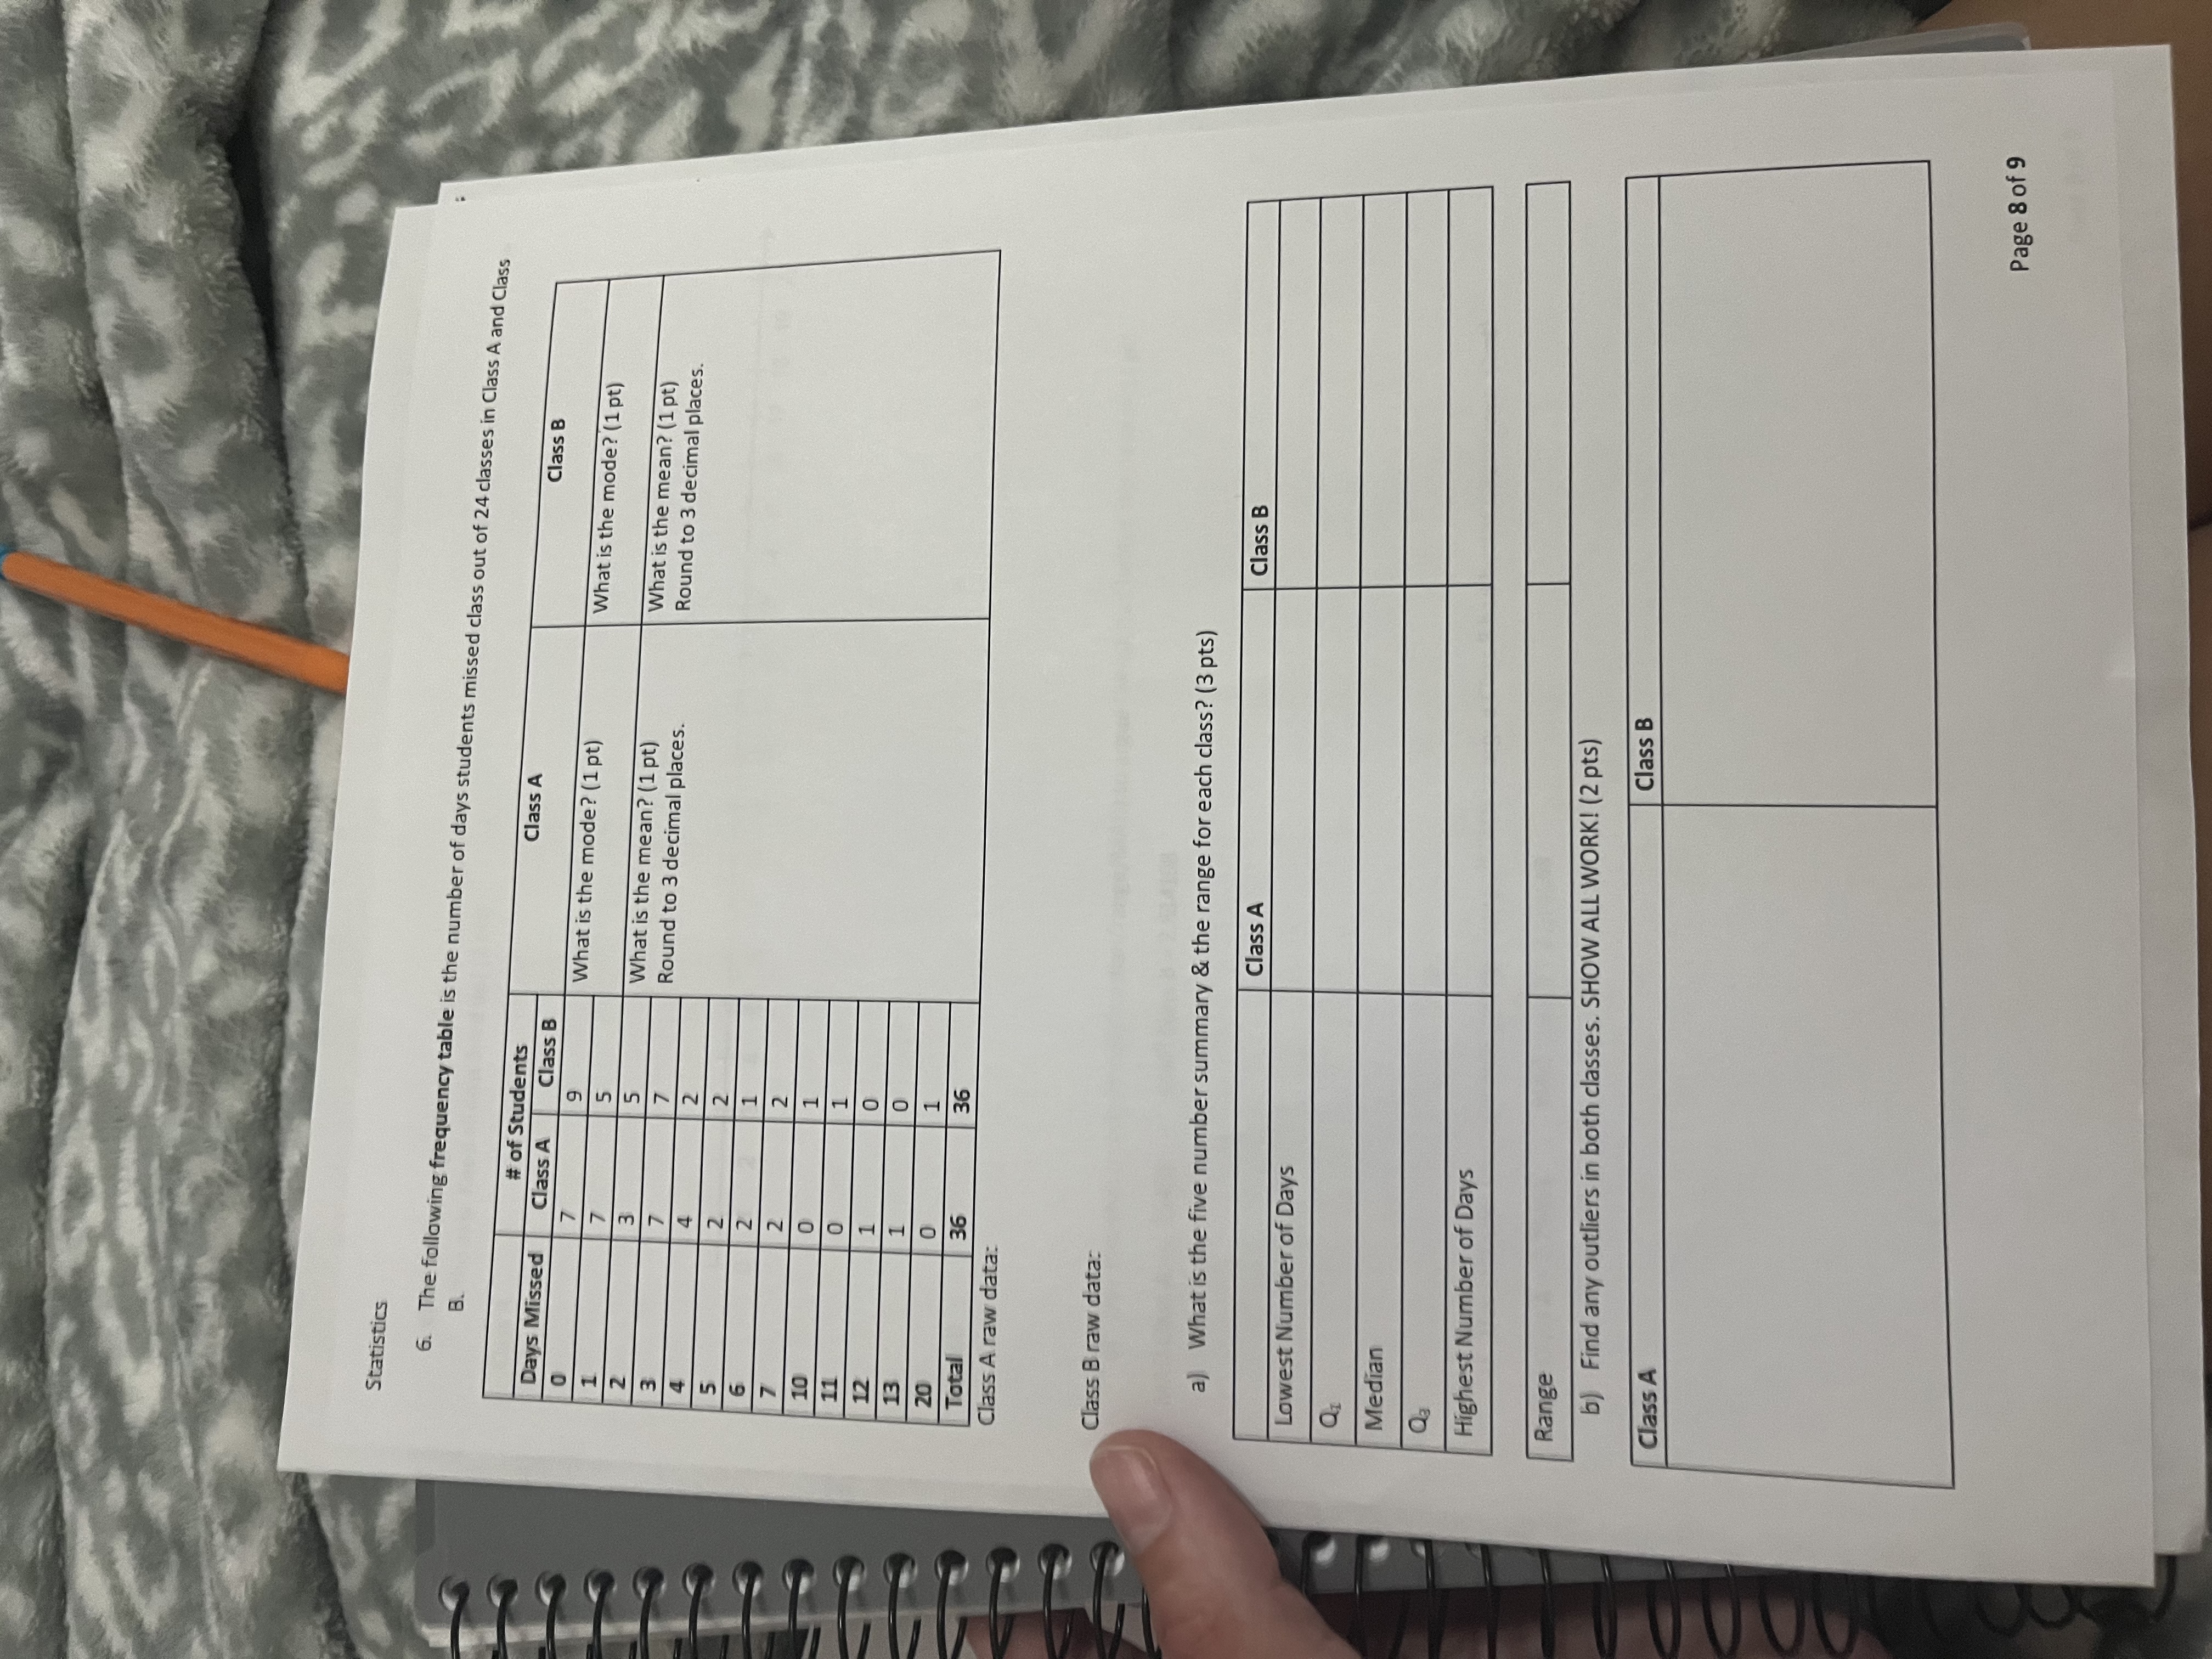
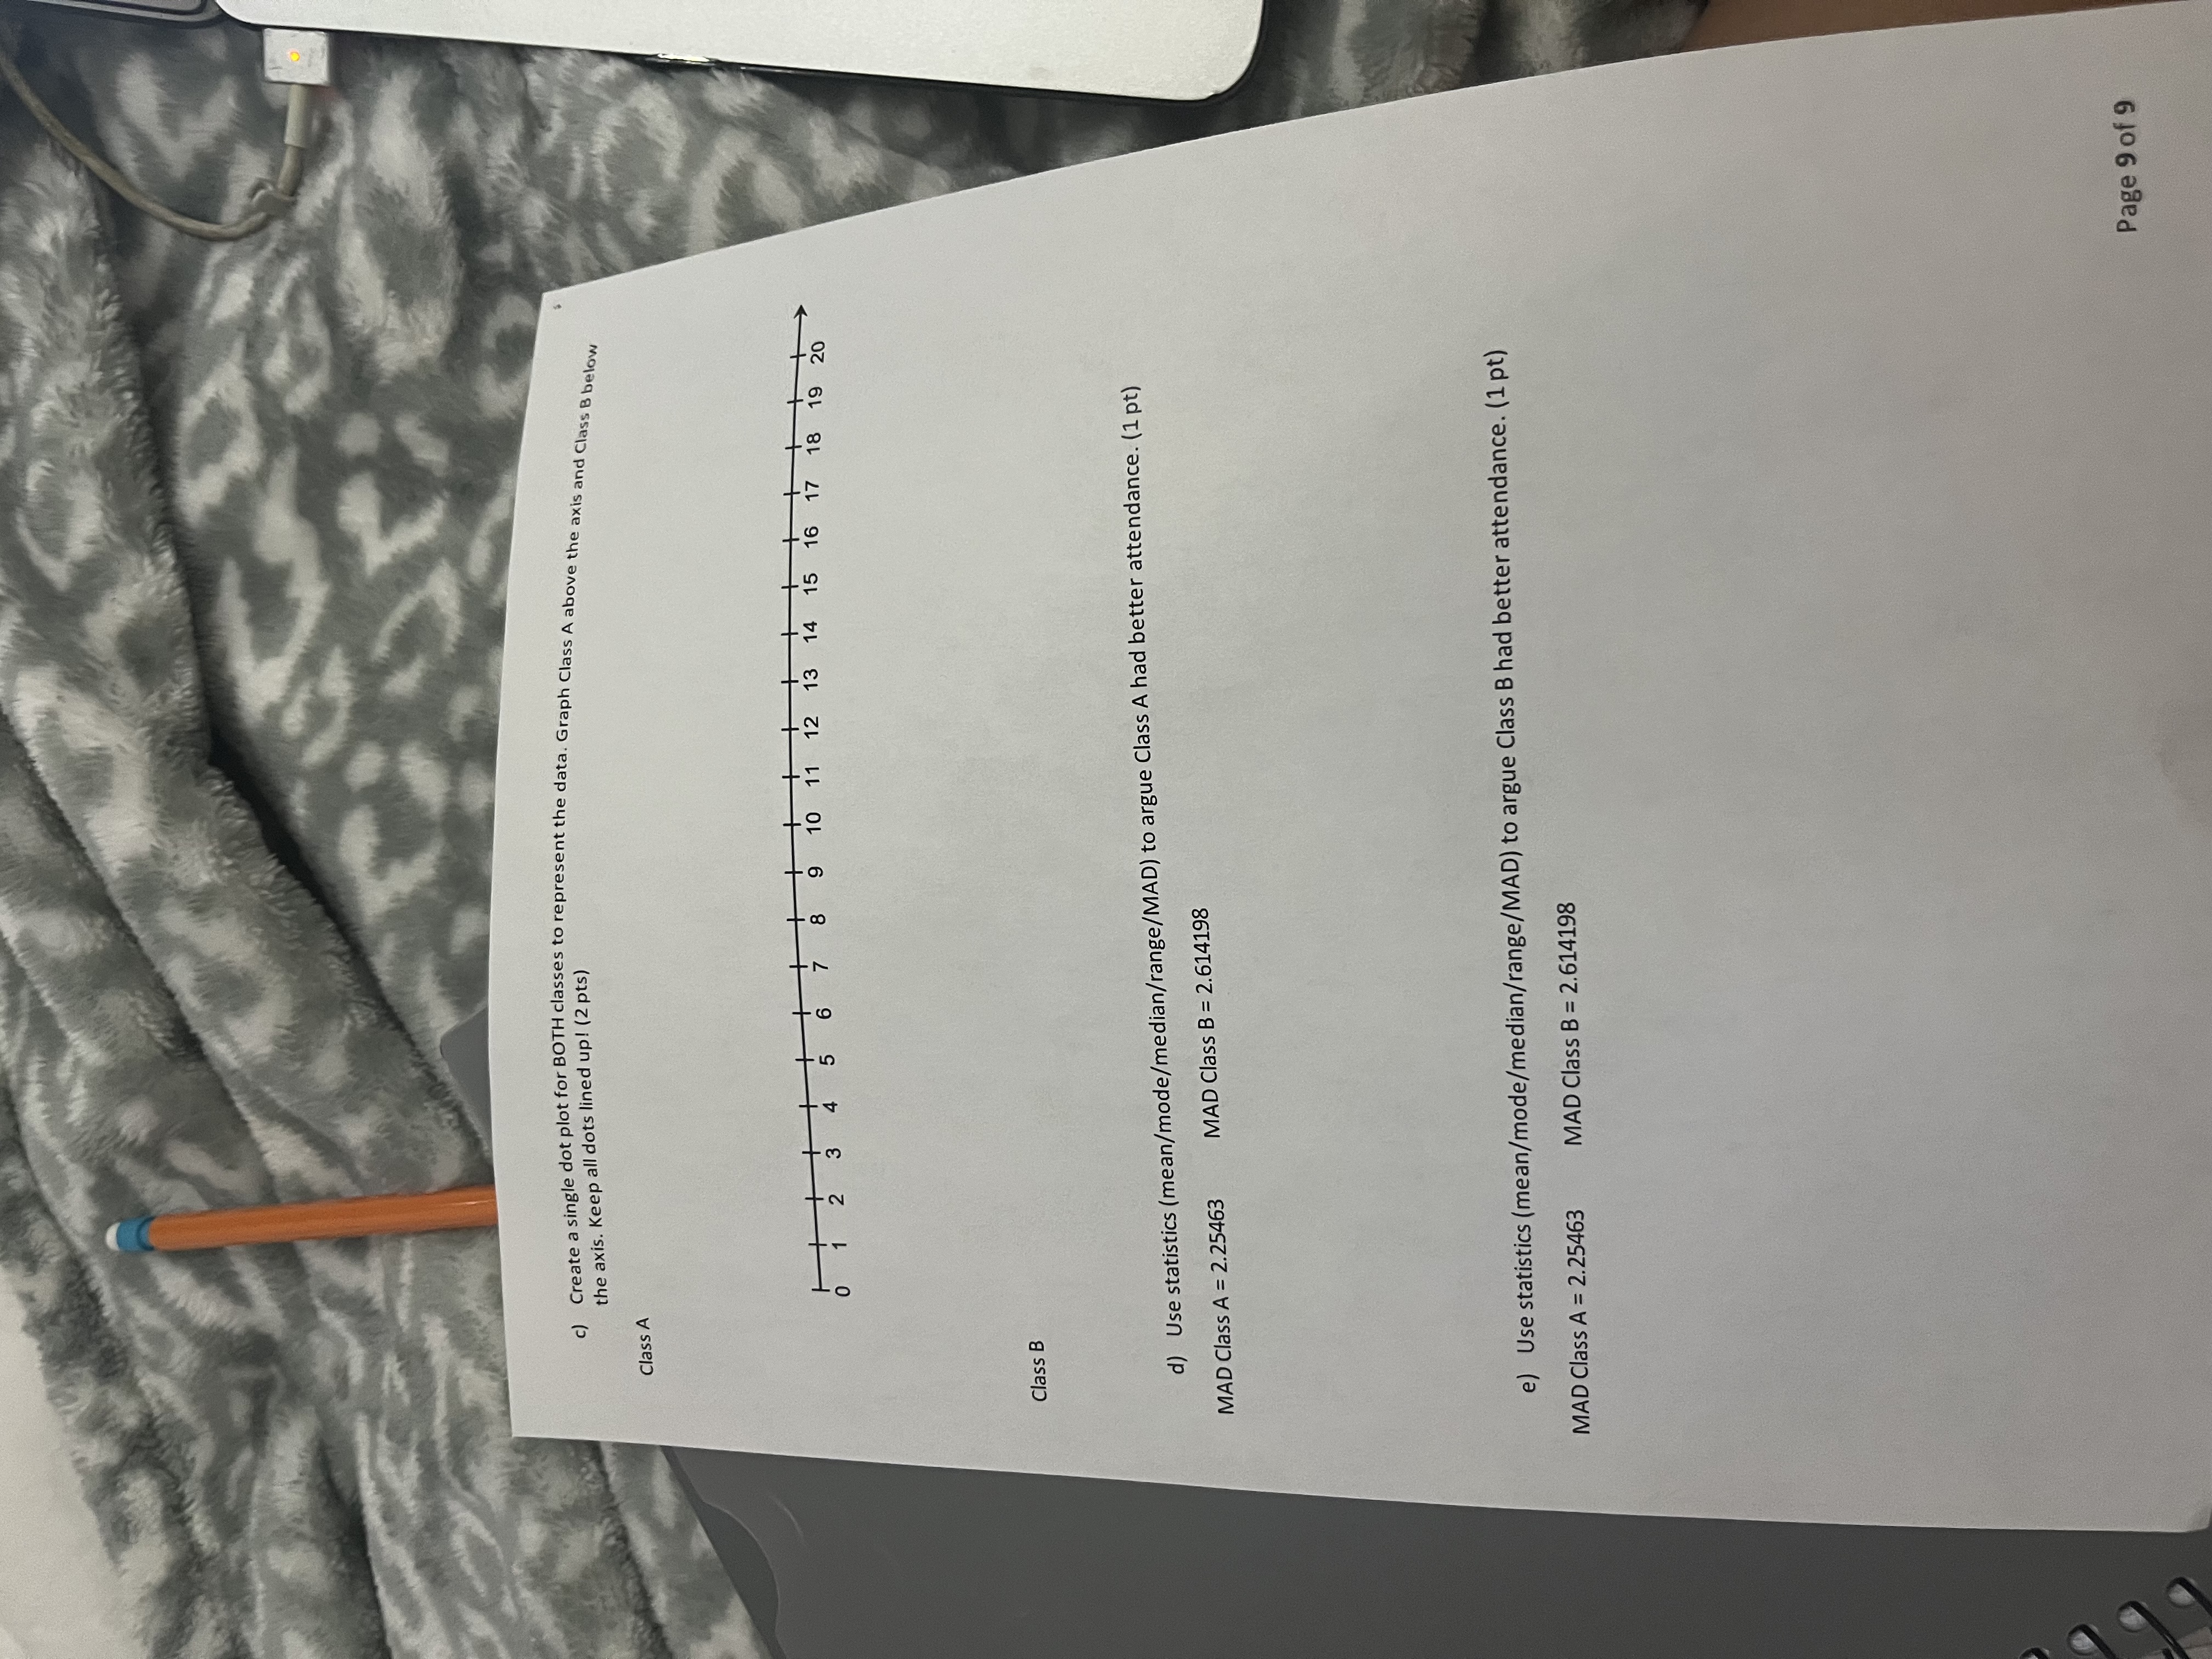
Statistics B. 6. The following frequency table is the number of days students missed class out of 24 classes in Class A and Class # of Students Class A Days Missed Class A Class B Class B What is the mode? (1 pt) What is the mode? (1 pt) What is the mean? (1 pt) What is the mean? (1 pt) Round to 3 decimal places. Round to 3 decimal places. SN OH H OO N N N A V W Total Class A raw data: Class B raw data: a) What is the five number summary & the range for each class? (3 pts) Class A Class B Lowest Number of Days Median Q3 Highest Number of Days Range b) Find any outliers in both classes. SHOW ALL WORK! (2 pts) Class B Class A Page 8 of 9c) Create a single dot plot for BOTH classes to represent the data. Graph Class A above the axis and Class B below the axis. Keep all dots lined up! (2 pts) Class A 6 1 2 3 4 5 6 8 9 10 11 13 14 15 16 17 18 19 20 Class B d) Use statistics (mean/mode/median/range/MAD) to argue Class A had better attendance. (1 pt) MAD Class A = 2.25463 MAD Class B = 2.614198 e) Use statistics (mean/mode/median/range/MAD) to argue Class B had better attendance. (1 pt) MAD Class A = 2.25463 MAD Class B = 2.614198 Page 9 of 9
Step by Step Solution
There are 3 Steps involved in it

Get step-by-step solutions from verified subject matter experts