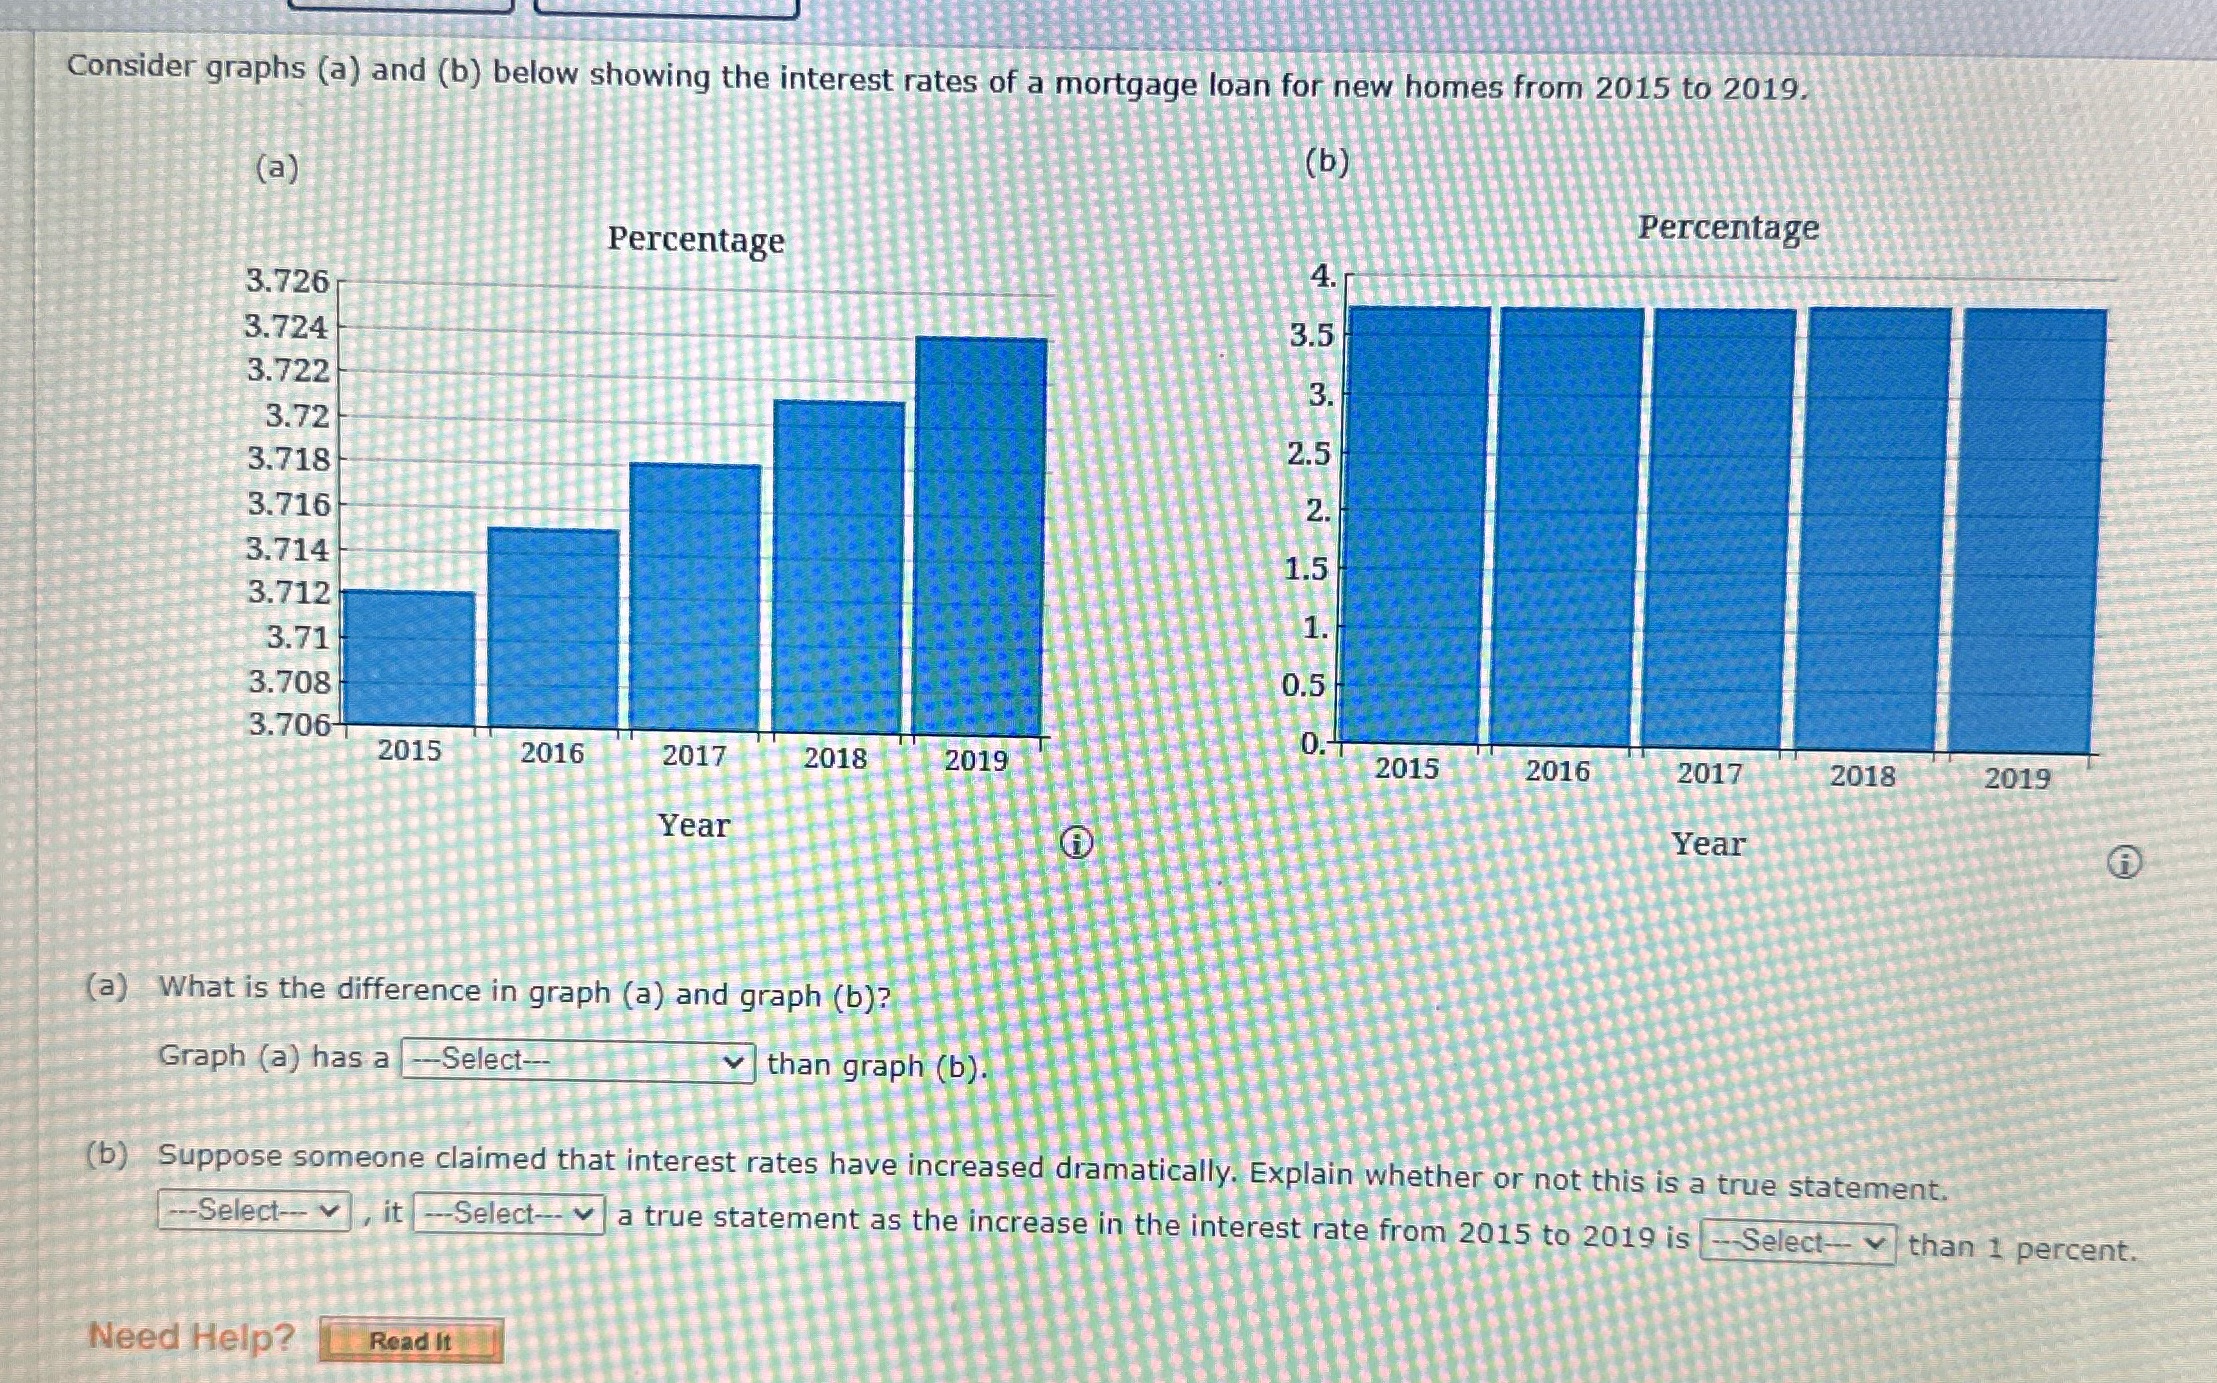
Question: Statistics Consider graphs (a) and (b) below showing the interest rates of a mortgage loan for new homes from 2015 to 2019. (a) (b) Percentage

Statistics

Statistics Consider graphs (a) and (b) below
Consider graphs (a) and (b) below showing the interest rates of a mortgage loan for new homes from 2015 to 2019. (a) (b) Percentage Percentage 3.726 4. 3.724 3.722 3.72 3.718 3.716 3.714 3.712 3.71 3.708 0.5 3.706- 0. 2015 2016 2017 2018 2019 2015 2016 2019 Year Year (a) What is the difference in graph (a) and graph (b)? Graph (a) has a -Select-- |than graph (b). (b) Suppose someone claimed that interest rates have increased dramatically. Explain whether or not this is a true statement. ---Select--, it --Select-- a true statement as the increase in the interest rate from 2015 to 2019 is - Select- v than 1 percent. Need Help? Read It

Step by Step Solution

There are 3 Steps involved in it

1 Expert Approved Answer
Step: 1 Unlock blur-text-image
Question Has Been Solved by an Expert!

Get step-by-step solutions from verified subject matter experts

Step: 2 Unlock
Step: 3 Unlock

Students Have Also Explored These Related Mathematics Questions!