

Question: Statistics: Construct a scatterplot from the given data, Determine the Pearson product-moment coefficient correlation between the two variables, and Interpret the degree of relationship between
Statistics: Construct a scatterplot from the given data, Determine the Pearson product-moment coefficient correlation between the two variables, and Interpret the degree of relationship between the two variables. Thank you
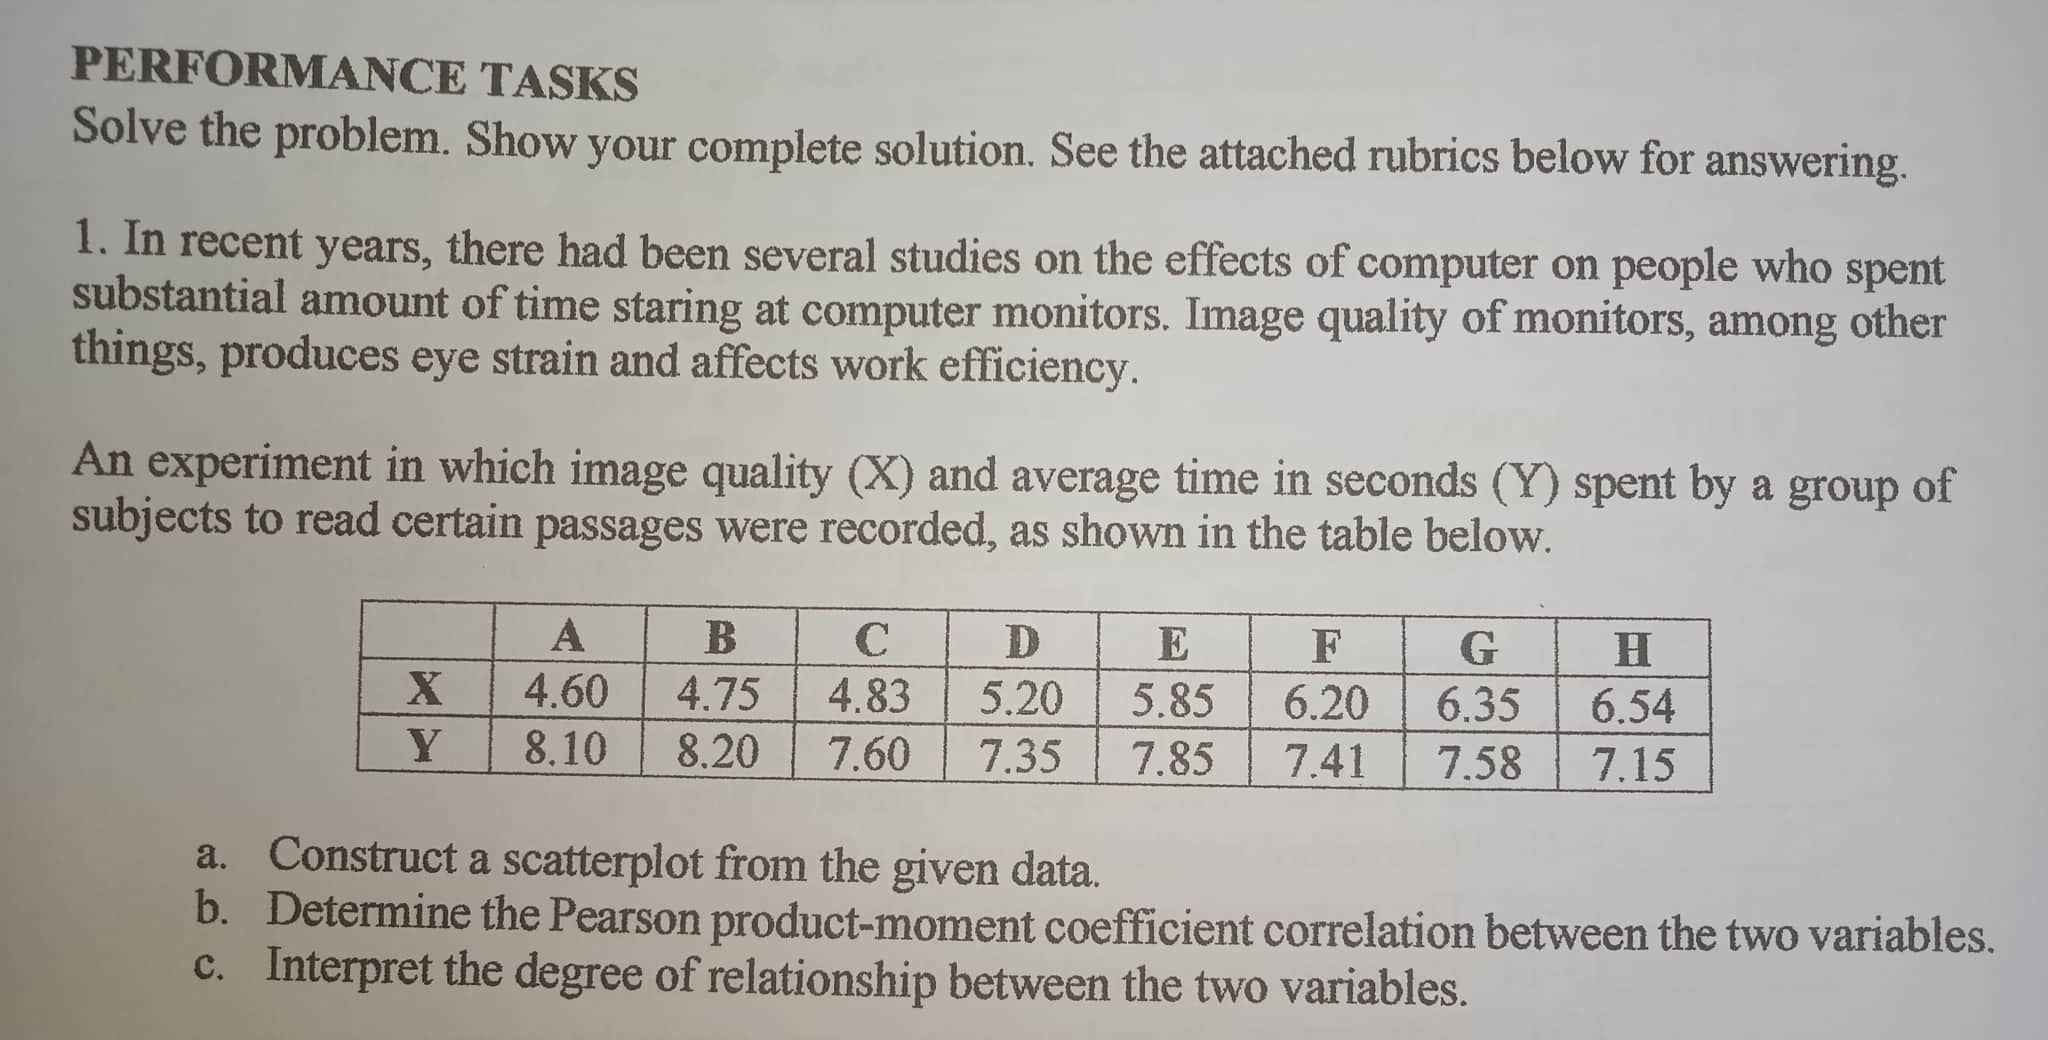
PERFORMANCE TASKS Solve the problem. Show your complete solution. See the attached rubrics below for answering. 1. In recent years, there had been several studies on the effects of computer on people who spent substantial amount of time staring at computer monitors. Image quality of monitors, among other things, produces eye strain and affects work efficiency. An experiment in which image quality (X) and average time in seconds (Y) spent by a group of subjects to read certain passages were recorded, as shown in the table below. A B C D E F G H X 4.60 4.75 4,83 5.20 5.85 6.20 6.35 6.54 Y 8.10 8.20 7.60 7.35 7.85 7.41 7.58 7.15 a. Construct a scatterplot from the given data. b. Determine the Pearson product-moment coefficient correlation between the two variables. c. Interpret the degree of relationship between the two variables
Step by Step Solution
There are 3 Steps involved in it

Get step-by-step solutions from verified subject matter experts