

Question: statistics (d) Question 4 (15 pts) Complete the ANOVA table. Table 1Analysis of Variance for Fitting Regression Source of Variation df Sum of Squares Mean
statistics
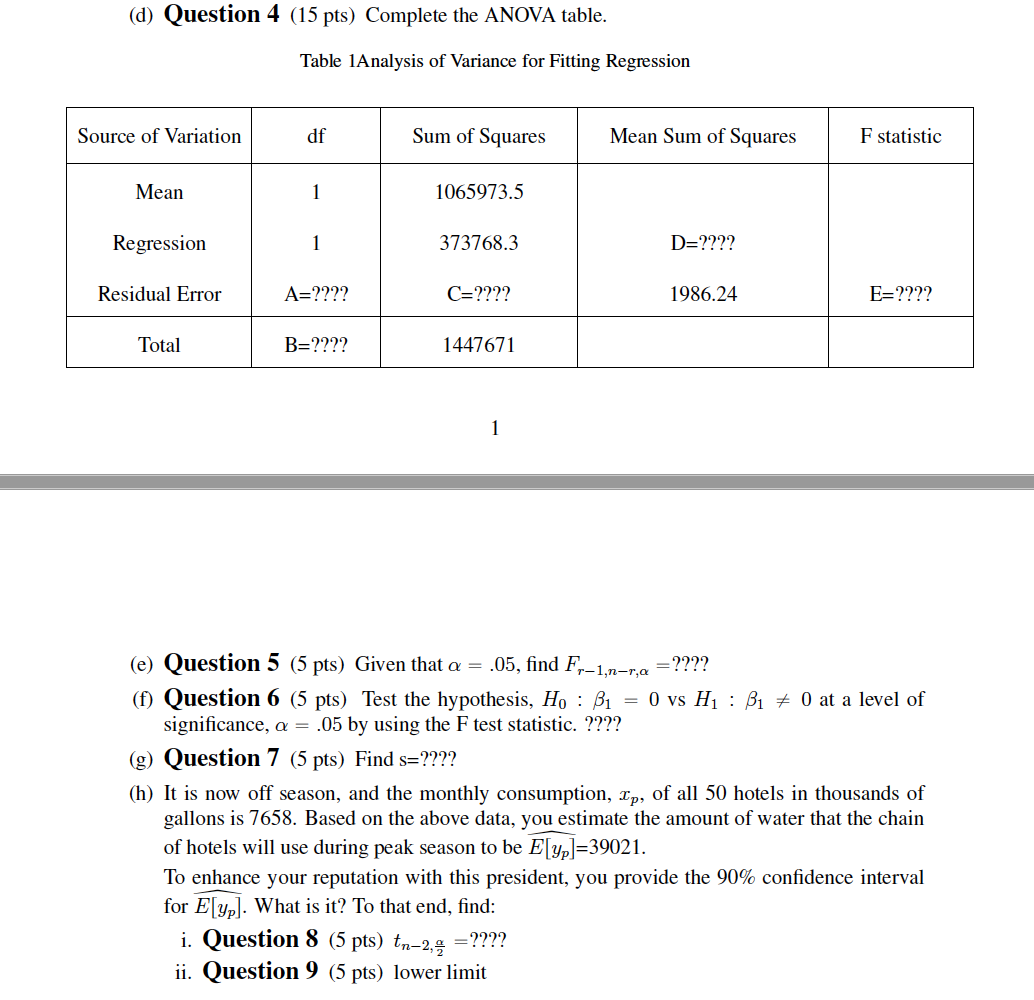
(d) Question 4 (15 pts) Complete the ANOVA table. Table 1Analysis of Variance for Fitting Regression Source of Variation df Sum of Squares Mean Sum of Squares F statistic Mean 1065973.5 Regression 1 373768.3 D=???? Residual Error A=???? C=???? 1986.24 E=???? Total B=???? 1447671 (e) Question 5 (5 pts) Given that a = .05, find Fr-1,n-r,a =???? (f) Question 6 (5 pts) Test the hypothesis, Ho : B1 = 0 vs H1 : B1 # 0 at a level of significance, a = .05 by using the F test statistic. ???? (g) Question 7 (5 pts) Find s=???? (h) It is now off season, and the monthly consumption, Ip, of all 50 hotels in thousands of gallons is 7658. Based on the above data, you estimate the amount of water that the chain of hotels will use during peak season to be E[yp]=39021. To enhance your reputation with this president, you provide the 90% confidence interval for E[yp]. What is it? To that end, find: i. Question 8 (5 pts) tn-2, =???? ii. Question 9 (5 pts) lower limit
Step by Step Solution
There are 3 Steps involved in it

Get step-by-step solutions from verified subject matter experts