

Question: Statistics Data 1 Representation - Box and Whisker Plot |l:|:|| 012345 91011121314151!|ig!o Data 2 Representation Histogram 7.00 13.00 1. Cont'dl (a) State whether the
Statistics

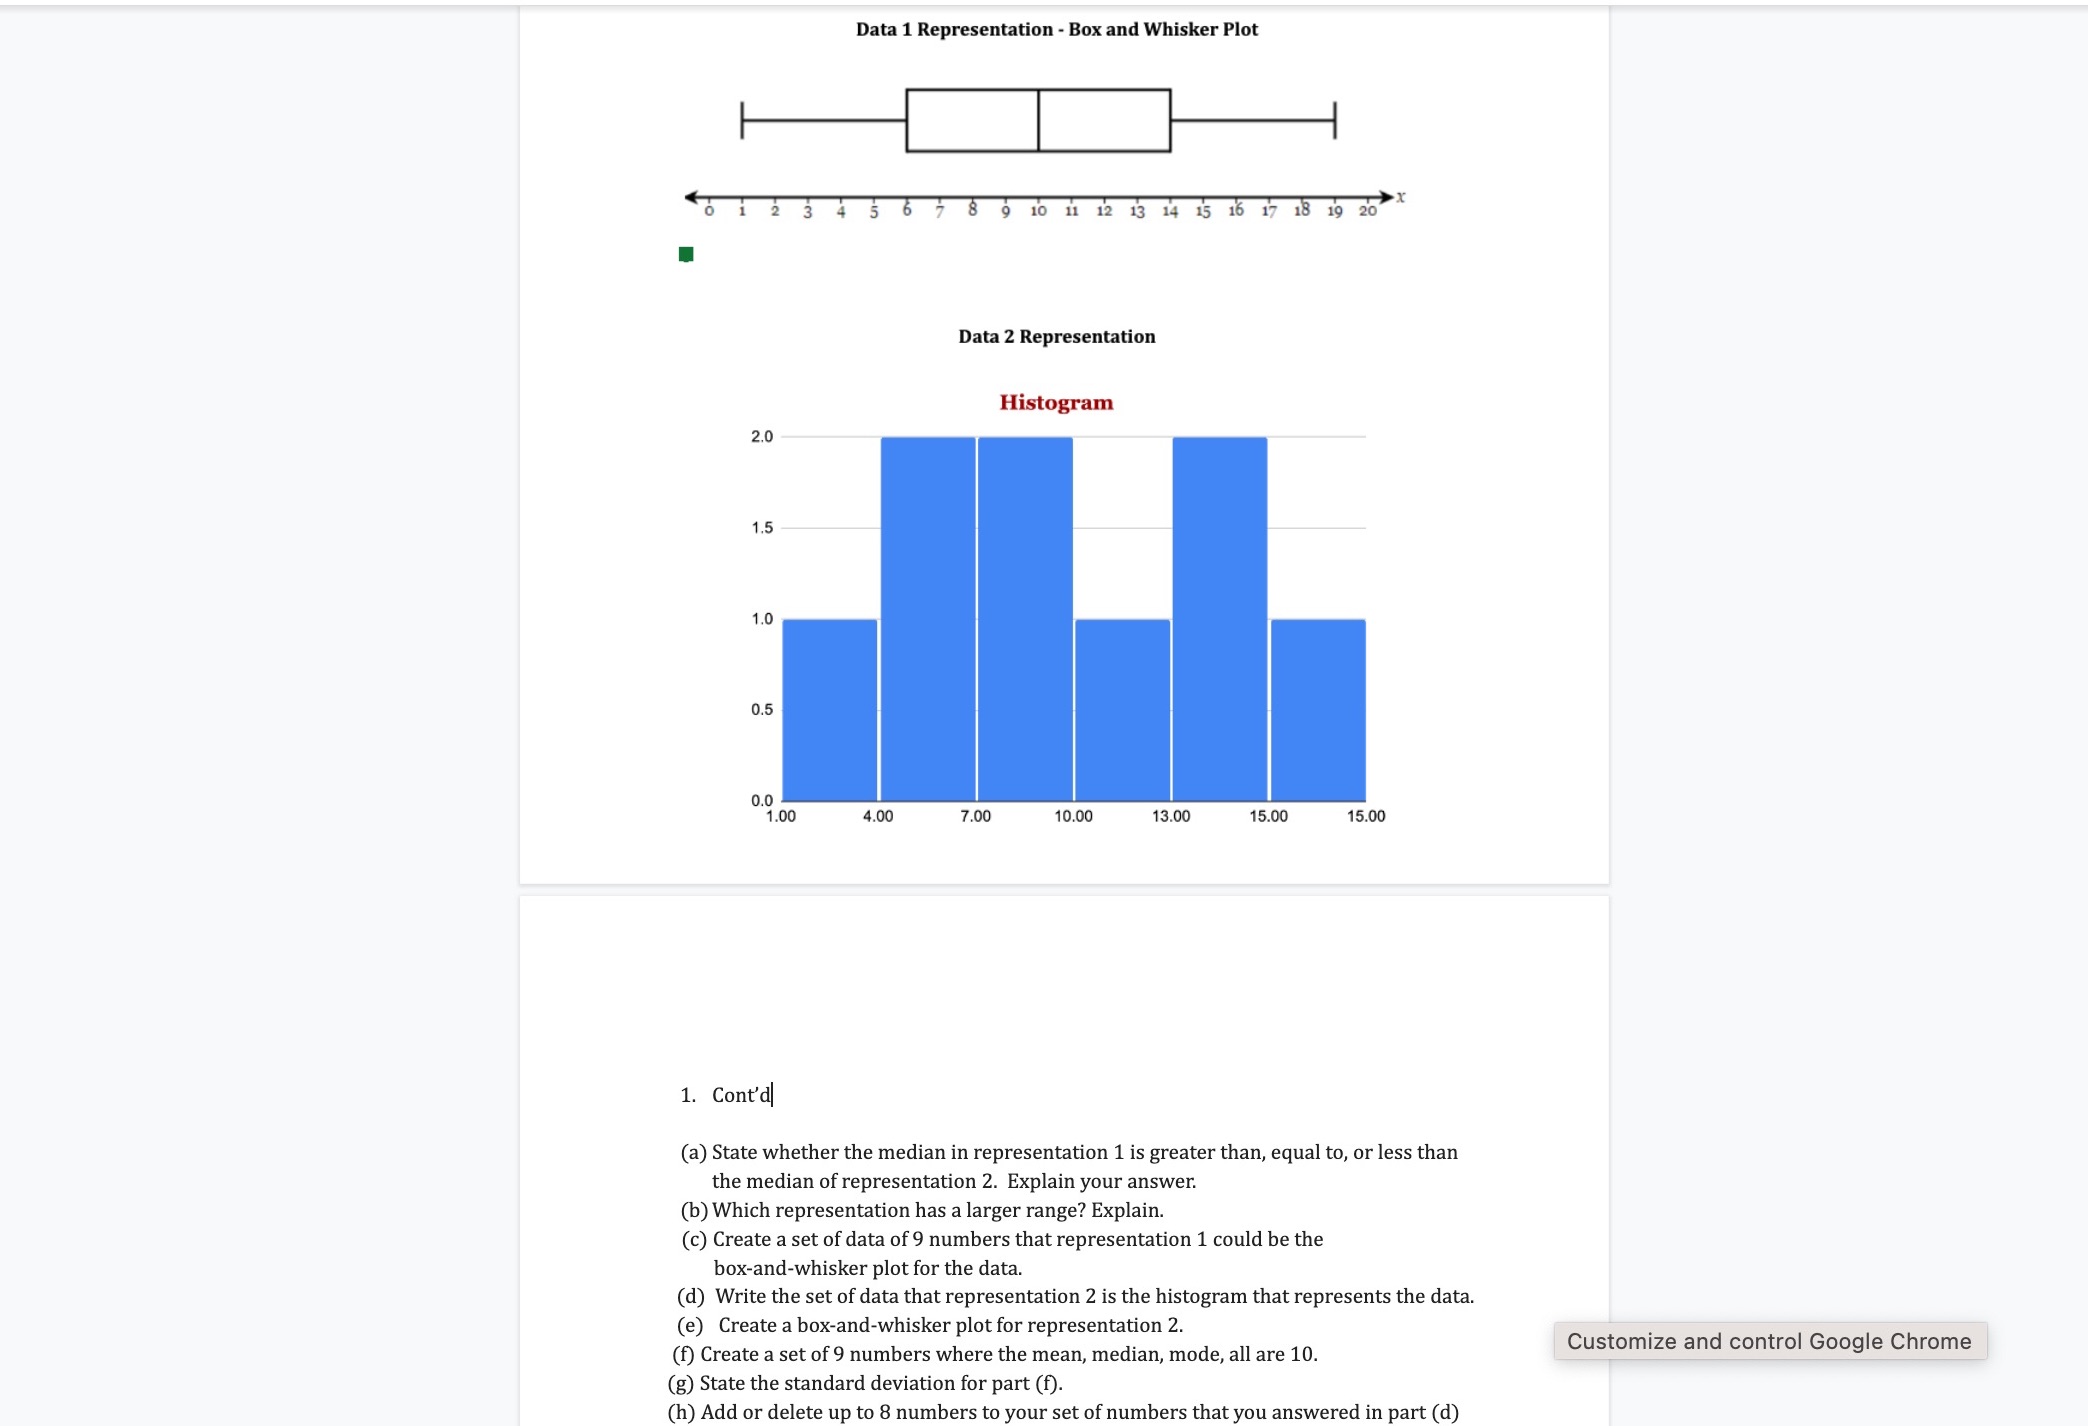
Data 1 Representation - Box and Whisker Plot |l:|:|| 012345 " 91011121314151!"|ig!o Data 2 Representation Histogram 7.00 13.00 1. Cont'dl (a) State whether the median in representation 1 is greater than, equal to, or less than the median of representation 2. Explain your answer. (b) Which representation has a larger range? Explain. (c) Create a set of data of 9 numbers that representation 1 could be the box-andwhisker plot for the data. (d) Write the set of data that representation 2 is the histogram that represents the data. (e) Create a buxand-whisker plot for representation 2. (0 Create a set of 9 numbers where the mean, median, mode, all are 10. (g) State the standard deviation for part (0. (h) Add or delete up to 8 numbers to your set of numbers that you answered in part (d) Customize and control Google Chrome
Step by Step Solution
There are 3 Steps involved in it

Get step-by-step solutions from verified subject matter experts