

Question: statistics Determine the area under the standard normal curve that lies to the right of the z-score 0.05 and to the left of the z-score
statistics
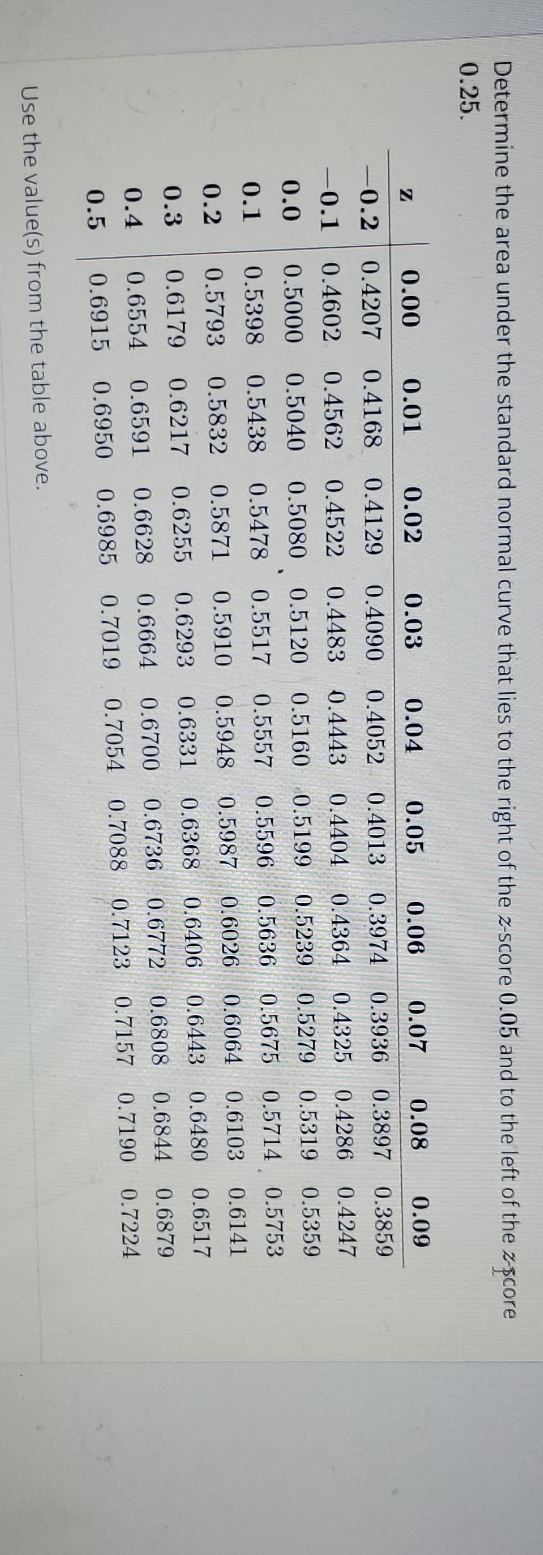
Determine the area under the standard normal curve that lies to the right of the z-score 0.05 and to the left of the z-score 0.25. N 0.00 0.01 0.02 0.03 0.04 0.05 0.06 0.07 0.08 0.09 0.2 0.4207 0.4168 0.4129 0.4090 0.4052 0.4013 0.3974 0.3936 0.3897 0.3859 0.1 0.4602 0.4562 0.4522 0.4483 0.4443 0.4404 0.4364 0.4325 0.4286 0.4247 0.0 0.5000 0.5040 0.5080 0.5120 0.5160 0.5199 0.5239 0.5279 0.5319 0.5359 0.1 0.5398 0.5438 0.5478 0.5517 0.5557 0.5596 0.5636 0.5675 0.5714 0.5753 0.2 0.5793 0.5832 0.5871 0.5910 0.5948 0.5987 0.6026 0.6064 0.6103 0.6141 0.3 0.6179 0.6217 0.6255 0.6293 0.6331 0.6368 0.6406 0.6443 0.6480 0.6517 0.4 0.6554 0.6591 0.6628 0.6664 0.6700 0.6736 0.6772 0.6808 0.6844 0.6879 0.5 0.6915 0.6950 0.6985 0.7019 0.7054 0.7088 0.7123 0.7157 0.7190 0.7224 Use the value(s) from the table above
Step by Step Solution
There are 3 Steps involved in it

Get step-by-step solutions from verified subject matter experts