

Question: Statistics Factorial Anova Graph Construction PART 5: GRAPH CONSTRUCTION (18 POINTS) 19. You are investigating overall life satisfaction of dog owners vs. cat owners and
Statistics Factorial Anova Graph Construction
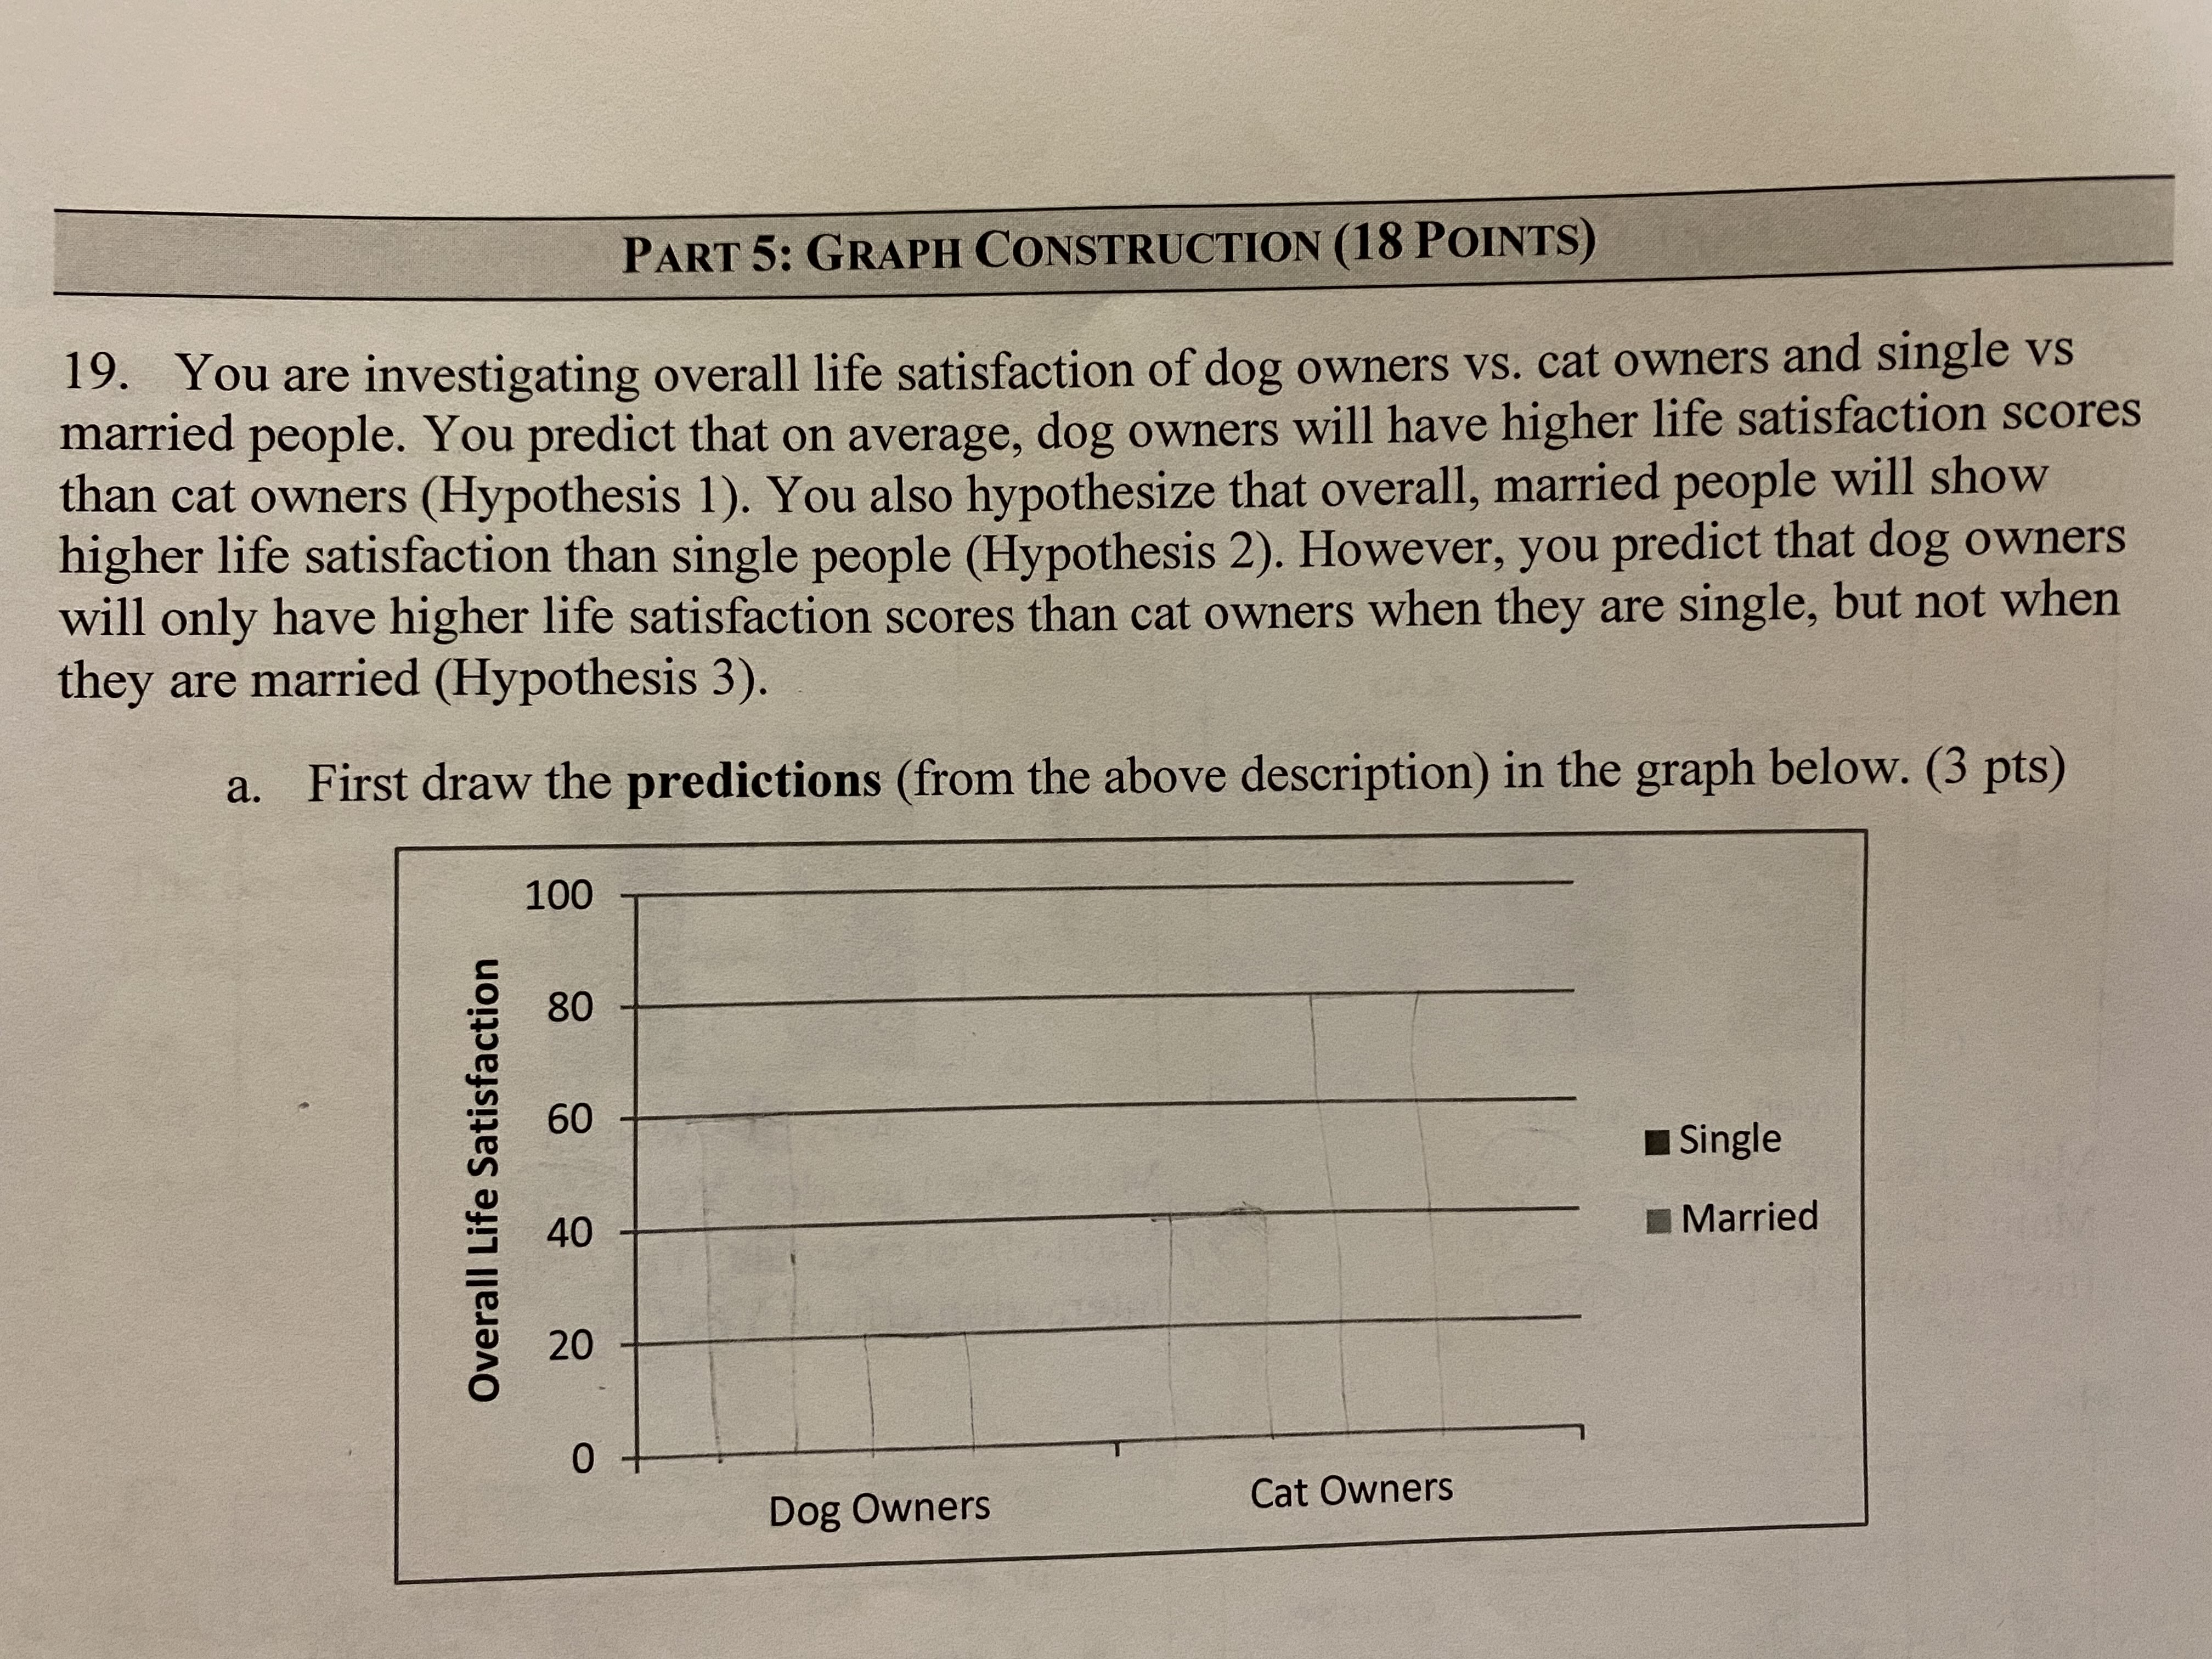
PART 5: GRAPH CONSTRUCTION (18 POINTS) 19. You are investigating overall life satisfaction of dog owners vs. cat owners and single vs married people. You predict that on average, dog owners will have higher life satisfaction scores than cat owners (Hypothesis 1). You also hypothesize that overall, married people will show higher life satisfaction than single people (Hypothesis 2). However, you predict that dog owners will only have higher life satisfaction scores than cat owners when they are single, but not when they are married (Hypothesis 3). a. First draw the predictions (from the above description) in the graph below. (3 pts) 100 80 60 Single Overall Life Satisfaction 40 Married 20 0 Dog Owners Cat Owners
Step by Step Solution
There are 3 Steps involved in it

Get step-by-step solutions from verified subject matter experts