

Question: Statistics has never been a spectator sport. Process behavior charts are no exception. You should see if you can compute the limits and construct an
Statistics has never been a spectator sport. Process behavior charts are no exception. You should see if you can compute the limits and construct an XmR chart.
- The U.S. Trade Deficits for the last half of 1988 are shown in Figure 6.7. Use the data in figure 6.7, and the blank form in figure 6.8 to plot the time series graph for the U.S. Trade Deficits for the last half of 1988.
- Use the data in Figure 6.7 to compute the monthly moving ranges. Note that moving ranges are defined to be positive values, and are found by computing the differences between successive values. Write these values in the space provided in Figure 6.8, and plot the running record of the moving ranges.
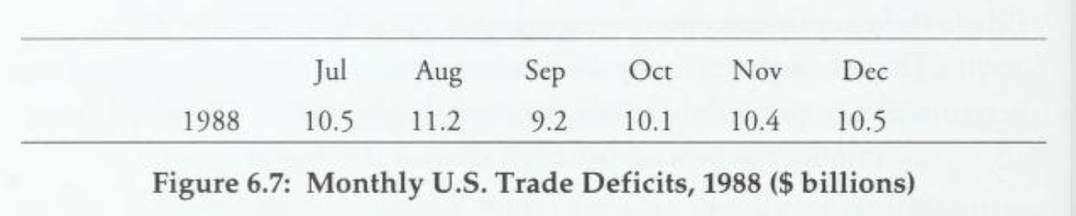
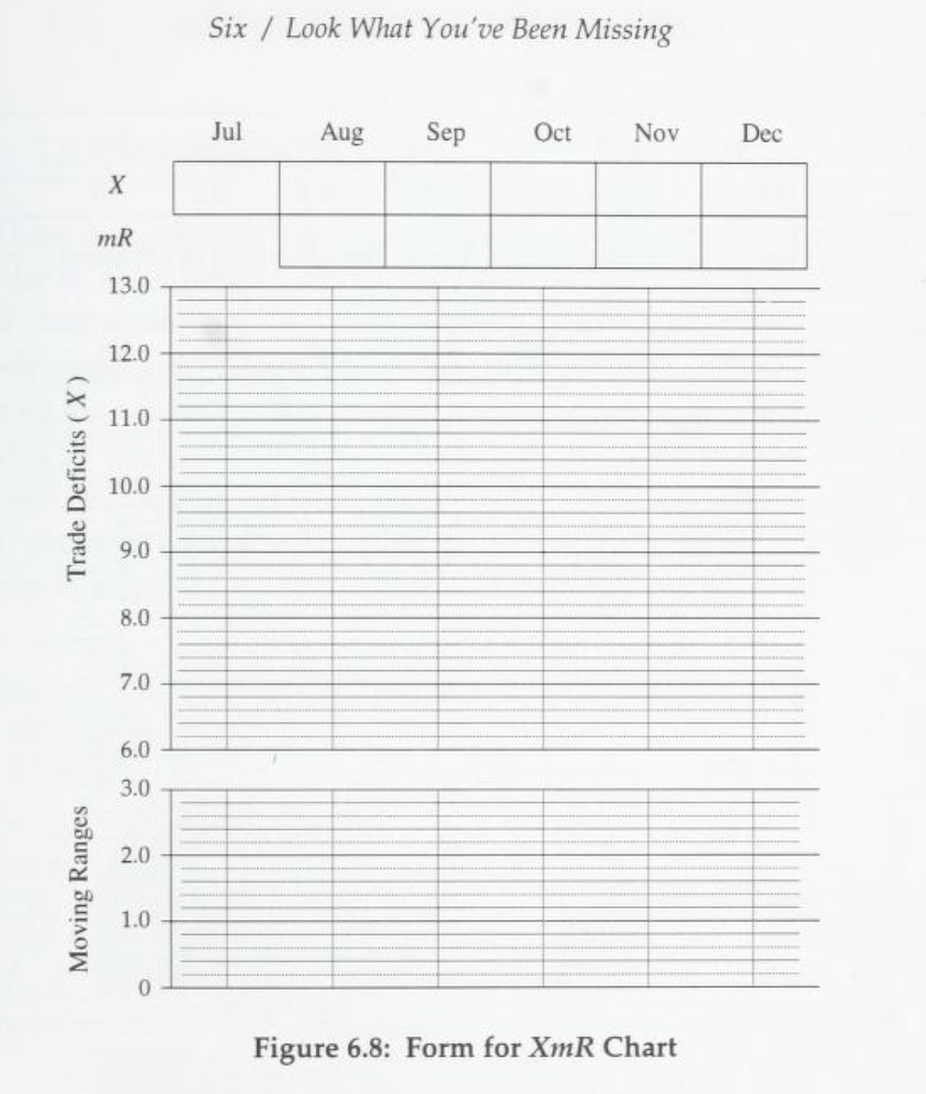
Jul Aug Sep Oct Nov Dec 1988 10.5 11.2 9.2 10.1 10.4 10.5 Figure 6.7: Monthly U.S. Trade Deficits, 1988 ($ billions)Six / Look What You've Been Missing Jul Aug Sep Oct Nov Dec X MR 13.0 12.0 11.0 Trade Deficits ( X ) 10.0 9.0 8.0 7.0 6.0 3.0 2.0 Moving Ranges 1.0 0 Figure 6.8: Form for XmR Chart
Step by Step Solution
There are 3 Steps involved in it
1 Expert Approved Answer
Step: 1 Unlock

Question Has Been Solved by an Expert!
Get step-by-step solutions from verified subject matter experts
Step: 2 Unlock
Step: 3 Unlock