

Question: Statistics help required AutoSave O Off) A Q - GA Assignment10 CH anika chowdhury AC X File Home Insert Design Layout References Mailings Review View
Statistics help required
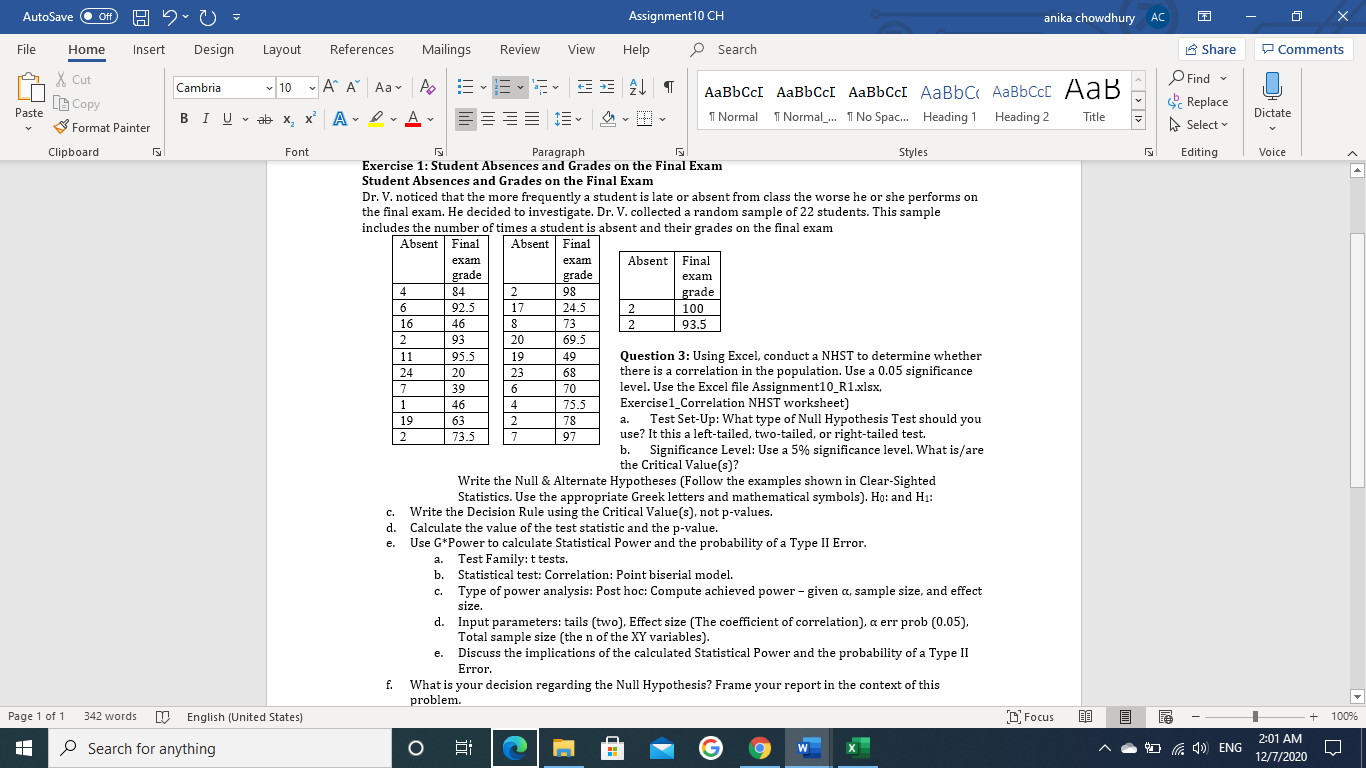
AutoSave O Off) A Q - GA Assignment10 CH anika chowdhury AC X File Home Insert Design Layout References Mailings Review View Help Search Share Comments X Cut 10 ~ A" A Aa* A AaB Find LO Cambria AaBbCcI AaBbCcI AaBbCcI AaBbCc AaBbCcC [a Copy Replace Paste 1 Normal 1 Normal_... 1 No Spac... Heading 1 Heading 2 Title Dictate Format Painter BIUX x A LA Select Clipboard Font Paragraph Styles Editing Voice Exercise 1: Student Absences and Grades on the Final Exam Student Absences and Grades on the Final Exam Dr. V. noticed that the more frequently a student is late or absent from class the worse he or she performs on the final exam. He decided to investigate. Dr. V. collected a random sample of 22 students. This sample includes the number of times a student is absent and their grades on the final exam Absent |Final Absent | Final exam xan Absent Final grade grade exam 84 2 98 grade 6 92.5 17 24.5 2 100 16 46 73 2 93.5 2 93 20 69. 11 95.5 19 49 Question 3: Using Excel, conduct a NHST to determine whether 24 20 23 68 there is a correlation in the population. Use a 0.05 significance 7 39 6 70 level. Use the Excel file Assignment10_R1.xlsx 1 46 4 75.5 Exercise1_Correlation NHST worksheet) 19 63 78 a. Test Set-Up: What type of Null Hypothesis Test should you 2 73.5 97 use? It this a left-tailed, two-tailed, or right-tailed test. b. Significance Level: Use a 5% significance level. What is/are the Critical Value(s)? Write the Null & Alternate Hypotheses (Follow the examples shown in Clear-Sighted Statistics. Use the appropriate Greek letters and mathematical symbols). Ho: and H1: C. Write the Decision Rule using the Critical Value(s), not p-values. P Calculate the value of the test statistic and the p-value. e. Use G*Power to calculate Statistical Power and the probability of a Type II Error. Test Family: t tests. b. Statistical test: Correlation: Point biserial model. C. Type of power analysis: Post hoc: Compute achieved power - given a, sample size, and effect size 1. Input parameters: tails (two), Effect size (The coefficient of correlation), a err prob (0.05), Total sample size (the n of the XY variables). Discuss the implications of the calculated Statistical Power and the probability of a Type II Error. f. What is your decision regarding the Null Hypothesis? Frame your report in the context of this problem. Page 1 of 1 342 words [ English (United States) Focus + 100% 2:01 AM Search for anything O G W A GY / ENG 12/7/2020
Step by Step Solution
There are 3 Steps involved in it

Get step-by-step solutions from verified subject matter experts