

Question: statistics math A random sample of n, = 16 communities in western Kansas gave the following information for people under 25 years of age. x
statistics math
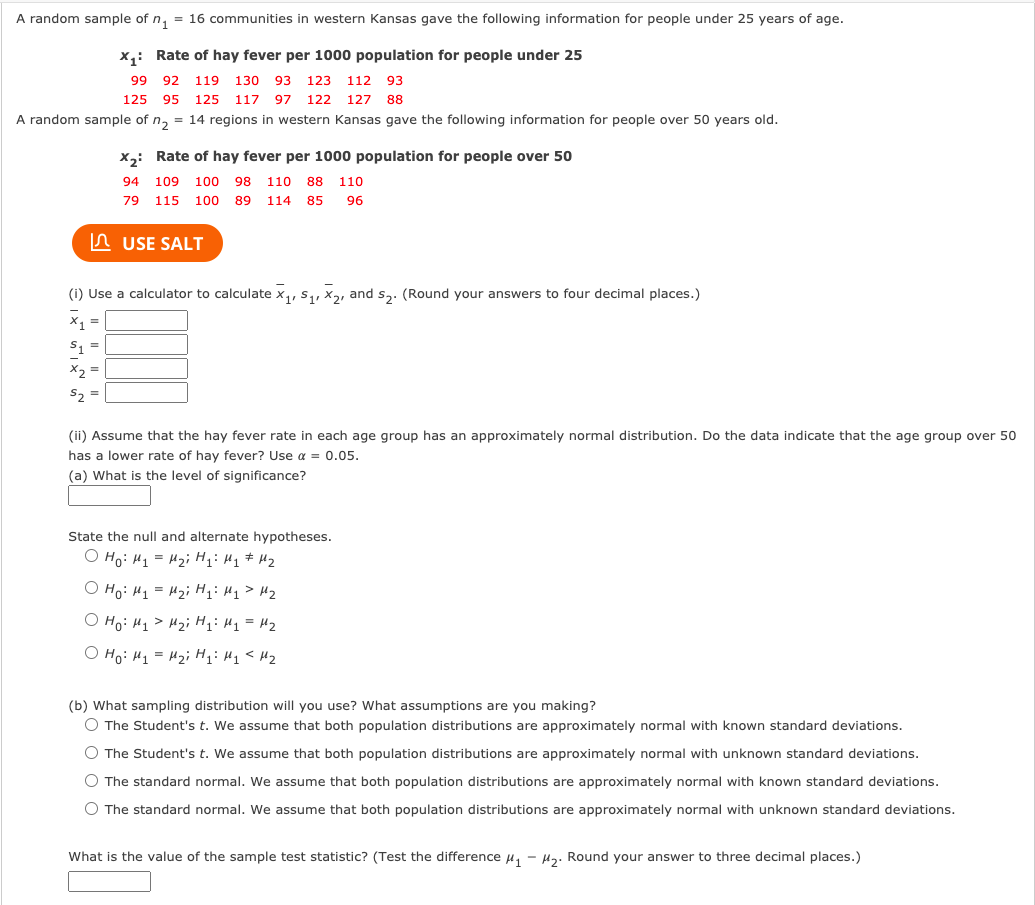
A random sample of n, = 16 communities in western Kansas gave the following information for people under 25 years of age. x : Rate of hay fever per 1000 population for people under 25 99 92 119 130 93 123 112 93 125 95 125 117 97 122 127 88 A random sample of n, = 14 regions in western Kansas gave the following information for people over 50 years old. x,: Rate of hay fever per 1000 population for people over 50 94 109 100 98 110 88 110 79 115 100 89 114 85 96 USE SALT (i) Use a calculator to calculate X1, $1, x2, and $2. (Round your answers to four decimal places.) 5 1 5 7 (ii) Assume that the hay fever rate in each age group has an approximately normal distribution. Do the data indicate that the age group over 50 has a lower rate of hay fever? Use a = 0.05. a) What is the level of significance? State the null and alternate hypotheses. O Ho: H1 = M2i H1: H1# #2 O Ho: M1 = #2i H1: H1 > H2 O Ho: H1 > H2i H1: H1 = H2 O HO: #1 = Hzi H1: M1 = H2 (b) What sampling distribution will you use? What assumptions are you making? O The Student's t. We assume that both population distributions are approximately normal with known standard deviations. The Student's t. We assume that both population distributions are approximately normal with unknown standard deviations. The standard normal. We assume that both population distributions are approximately normal with known standard deviations. The standard normal. We assume that both population distributions are approximately normal with unknown standard deviations. What is the value of the sample test statistic? (Test the difference #, - #,. Round your answer to three decimal places.)
Step by Step Solution
There are 3 Steps involved in it

Get step-by-step solutions from verified subject matter experts