

Question: statistics MULTIPLE CHOICE. Choose the one alternative that best completes the statement or answers the question. Provide an appropriate response. 1) The table below shows
statistics

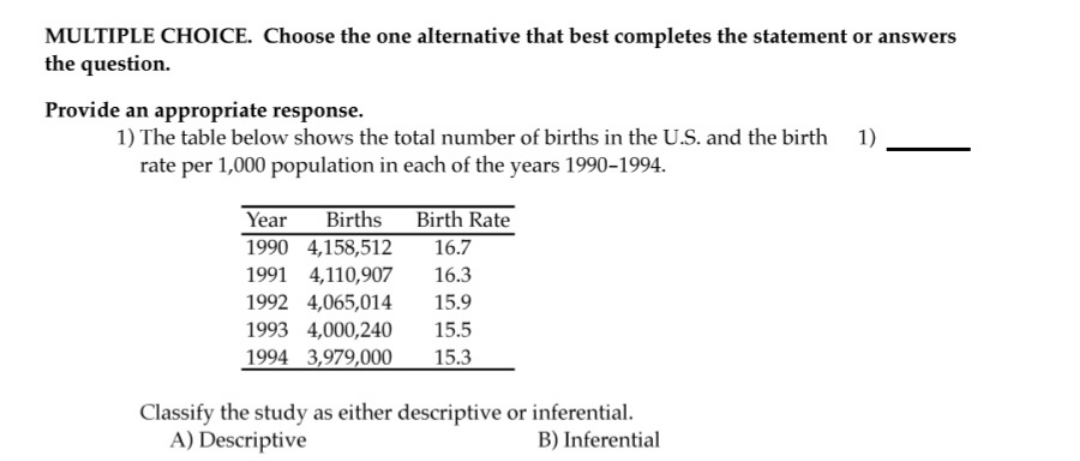
MULTIPLE CHOICE. Choose the one alternative that best completes the statement or answers the question. Provide an appropriate response. 1) The table below shows the total number of births in the [1.5. and the birth 1) rate per 1,000 population in each of the years 1990-1994. Year Births Birth Rate 1990 4,158,512 16.7 1991 4,110,907 16.3 1992 4,065,014 15.9 1993 4,000,240 15.5 1994 3:979:000 15.3 Classify the study as either descriptive or inferential. A) Descriptive B) lnferential
Step by Step Solution
There are 3 Steps involved in it
1 Expert Approved Answer
Step: 1 Unlock

Question Has Been Solved by an Expert!
Get step-by-step solutions from verified subject matter experts
Step: 2 Unlock
Step: 3 Unlock