

Question: Statistics NNN Name: (print) Email ID: Section: Homework 4 (non-Excel portion) Fall 2019 Due in class on Friday, October 25, 2019. Answers may be typed
Statistics

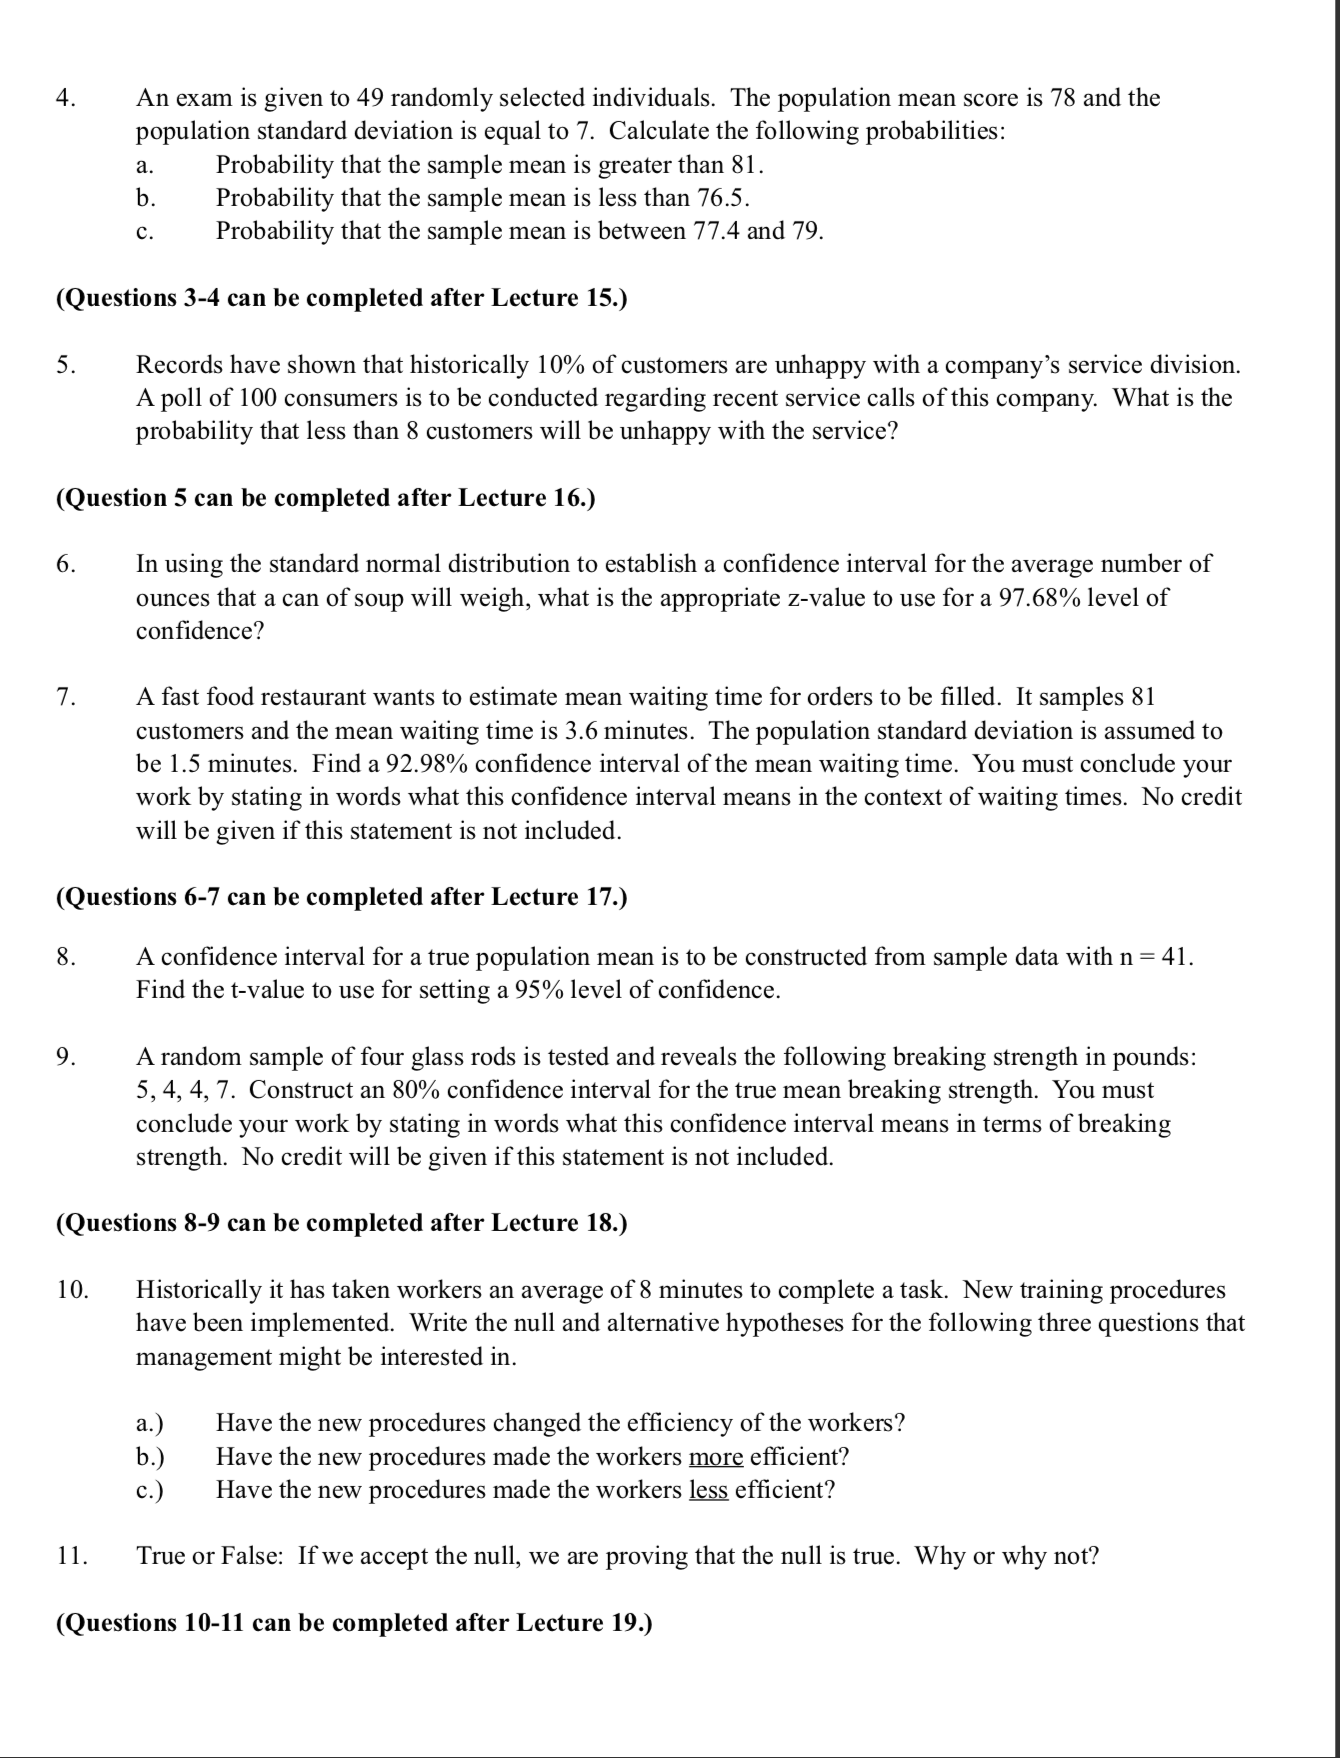

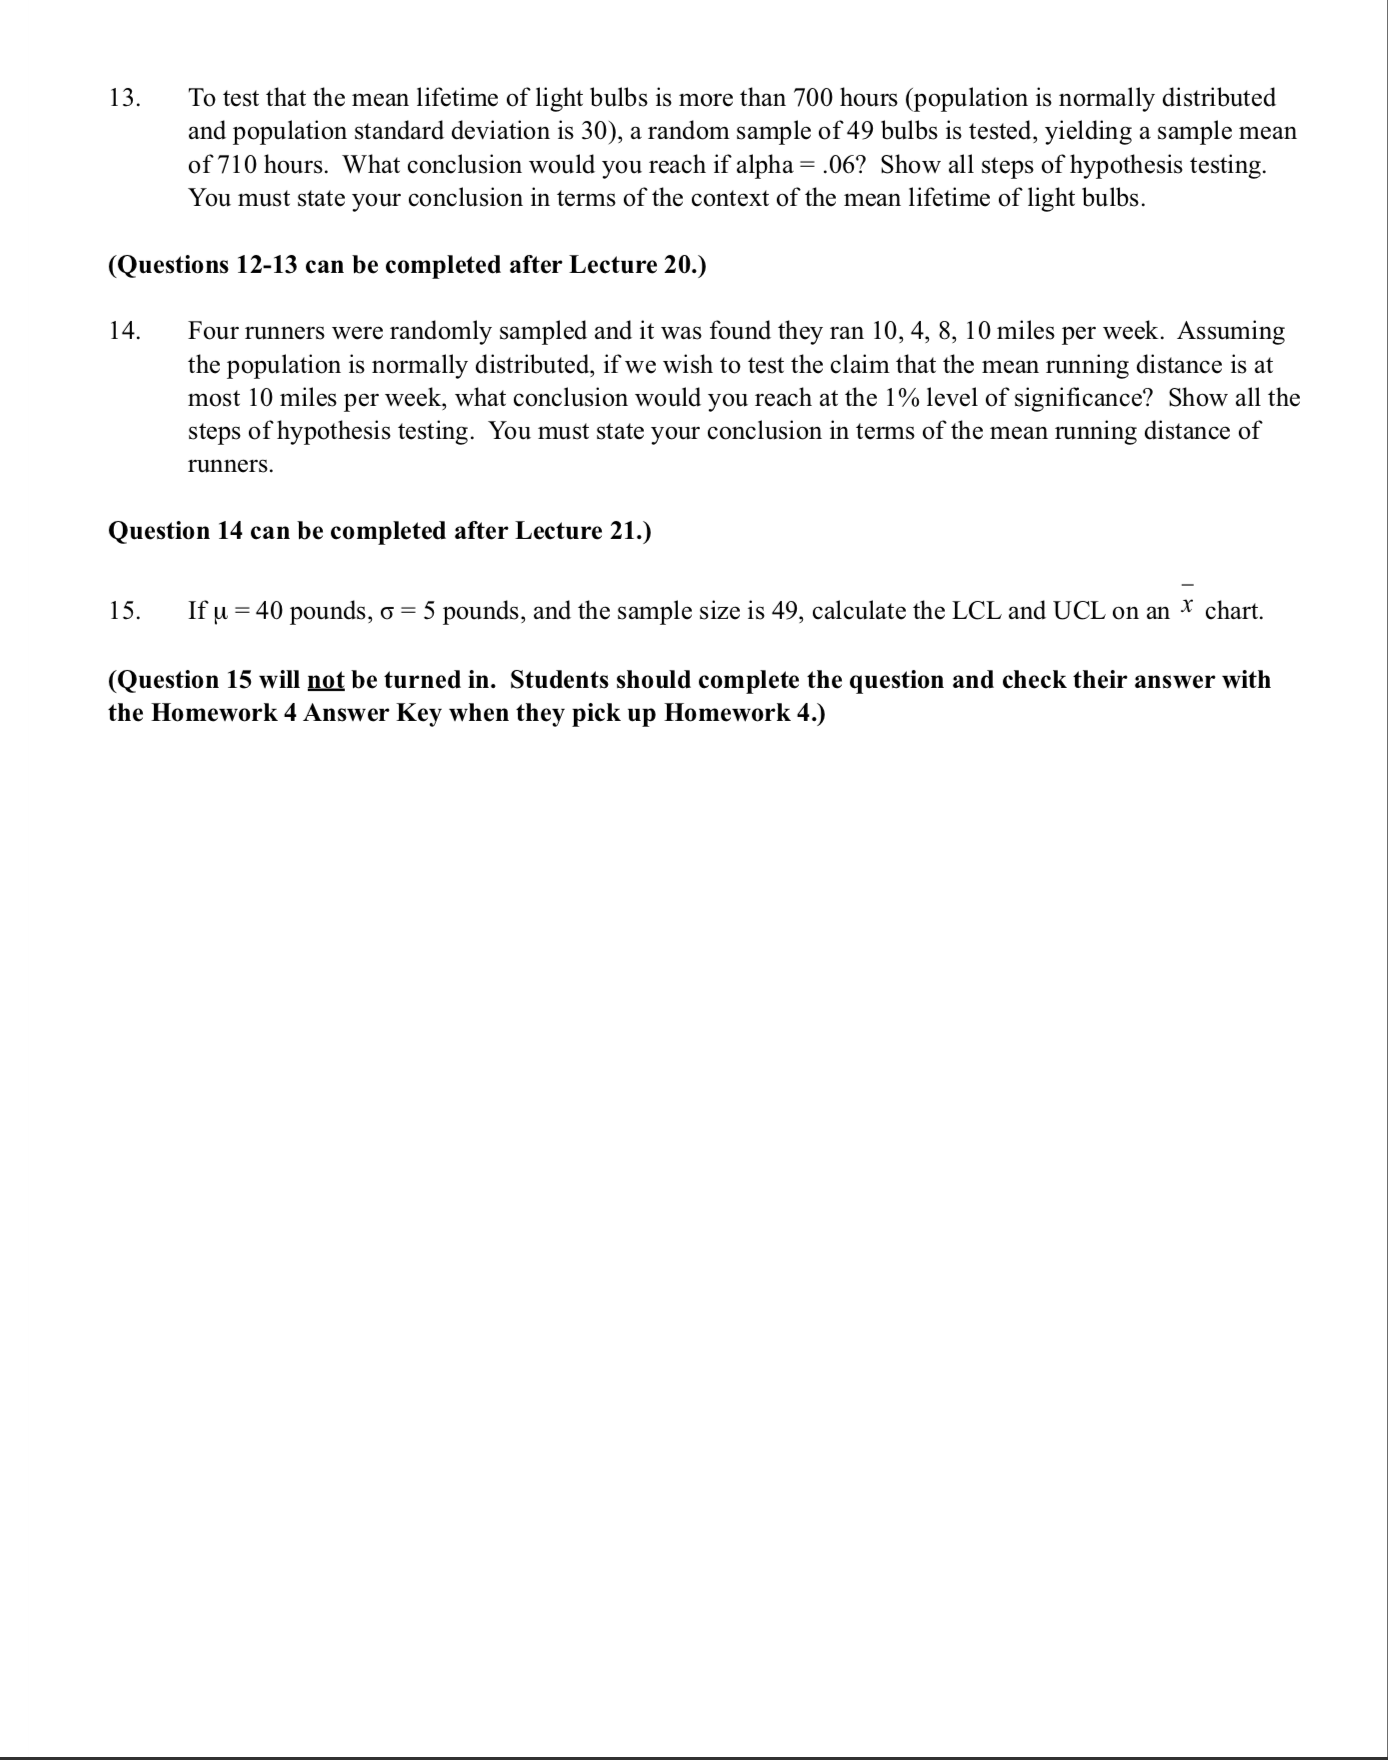
NNN Name: (print) Email ID: Section: Homework 4 (non-Excel portion) Fall 2019 Due in class on Friday, October 25, 2019. Answers may be typed or handwritten. Take your answers out to at least two decimal places. Homeworks are graded on completion, not accuracy. Work must be shown on the homework to receive full credit. Credit for completion will not be awarded if adequate effort has not been shown. The grade will be on the BACK of this signature sheet page of the homework. Each homework is worth 2.5 points. So, for example, if a student gets a score of 2.5, it means that they did all the work, it does not mean the answers are all correct. In order to promote professional development of students in learning the importance of appearance and presentation of submitted work, 0.1 point will be deducted from homework scores for each the following conditions that are not met (students could lose a total of 0.6 points for not meeting these conditions): Name, email ID, and section number filled in (the deduction will be taken if even one of the spaces is not filled in) Stapled (all pages) Questions numbered and done in order (all work and answers for each question in one place) Pages in order with signature sheet on top, followed by the non-Excel, then the Excel Increased space between each question if the answers are included on the posted homework assignment Homework turned in at the student's scheduled section (if students are handing in homework at a different section, the homework must be given to the instructor separately) If you take any definitions/concepts directly from the packet, please cite the page number in the packet. Please sign (don't type) the Academic Integrity Pledge below: I, , affirm that I have not and will not give or receive unauthorized aid on this deliverable, and I will complete this work honestly and according to the instructor's guidelines. (This signature sheet must be included as the top sheet of your stapled homework packet, even if all work is done on a separate sheet of paper.) If the pledge is not signed, the homework grade will remain a 0 until the pledge is signed. YOU MUST SHOW WORK TO GET CREDIT. 1. Define sampling distribution. 2. Define standard error. (Questions 1-2 can be completed after Lecture 14.)3. A random sample of size 64 is taken. The population mean is equal to 400 and the population standard deviation is equal to 40. Calculate the standard error of the mean. 4 . An exam is given to 49 randomly selected individuals. The population mean score is 78 and the population standard deviation is equal to 7. Calculate the following probabilities: a. Probability that the sample mean is greater than 81. b Probability that the sample mean is less than 76.5. Probability that the sample mean is between 77.4 and 79. (Questions 3-4 can be completed after Lecture 15.) 5 Records have shown that historically 10% of customers are unhappy with a company's service division. A poll of 100 consumers is to be conducted regarding recent service calls of this company. What is the probability that less than 8 customers will be unhappy with the service? (Question 5 can be completed after Lecture 16.) 6. In using the standard normal distribution to establish a confidence interval for the average number of ounces that a can of soup will weigh, what is the appropriate z-value to use for a 97.68% level of confidence? 7. A fast food restaurant wants to estimate mean waiting time for orders to be filled. It samples 81 customers and the mean waiting time is 3.6 minutes. The population standard deviation is assumed to be 1.5 minutes. Find a 92.98% confidence interval of the mean waiting time. You must conclude your work by stating in words what this confidence interval means in the context of waiting times. No credit will be given if this statement is not included. (Questions 6-7 can be completed after Lecture 17.) 8. A confidence interval for a true population mean is to be constructed from sample data with n = 41. Find the t-value to use for setting a 95% level of confidence. 9 . A random sample of four glass rods is tested and reveals the following breaking strength in pounds: 5, 4, 4, 7. Construct an 80% confidence interval for the true mean breaking strength. You must conclude your work by stating in words what this confidence interval means in terms of breaking strength. No credit will be given if this statement is not included. (Questions 8-9 can be completed after Lecture 18.) 10. Historically it has taken workers an average of 8 minutes to complete a task. New training procedures have been implemented. Write the null and alternative hypotheses for the following three questions that management might be interested in. a. ) Have the new procedures changed the efficiency of the workers? b . ) Have the new procedures made the workers more efficient? C. ) Have the new procedures made the workers less efficient? 11. True or False: If we accept the null, we are proving that the null is true. Why or why not? (Questions 10-11 can be completed after Lecture 19.)12. For a zvalue of 1.24, compute a pvalue for an uppertail test, a lowertail test, AND a twotail test. 13. To test that the mean lifetime of light bulbs is more than 700 hours (population is normally distributed and population standard deviation is 30), a random sample of 49 bulbs is tested, yielding a sample mean of 710 hours. What conclusion would you reach if alpha = .06? Show all steps of hypothesis testing. You must state your conclusion in terms of the context of the mean lifetime of light bulbs. (Questions 12-13 can be completed after Lecture 20.) 14. Four runners were randomly sampled and it was found they ran 10, 4, 8, 10 miles per week. Assuming the population is normally distributed, if we wish to test the claim that the mean running distance is at most 10 miles per week, what conclusion would you reach at the 1% level of signicance? Show all the steps of hypothesis testing. You must state your conclusion in terms of the mean running distance of runners. Question 14 can be completed after Lecture 21.) 15. If p. = 40 pounds, 5 = 5 pounds, and the sample size is 49, calculate the LCL and UCL on an 17 chart. (Question 15 will not be turned in. Students should complete the question and check their answer with the Homework 4 Answer Key when they pick up Homework 4.)
Step by Step Solution
There are 3 Steps involved in it

Get step-by-step solutions from verified subject matter experts