

Question: Statistics & Probability 26. Short Answer Question We have m = 5 preliminary samples of size n = 3 (some numbers have unfortunately been erased
Statistics & Probability
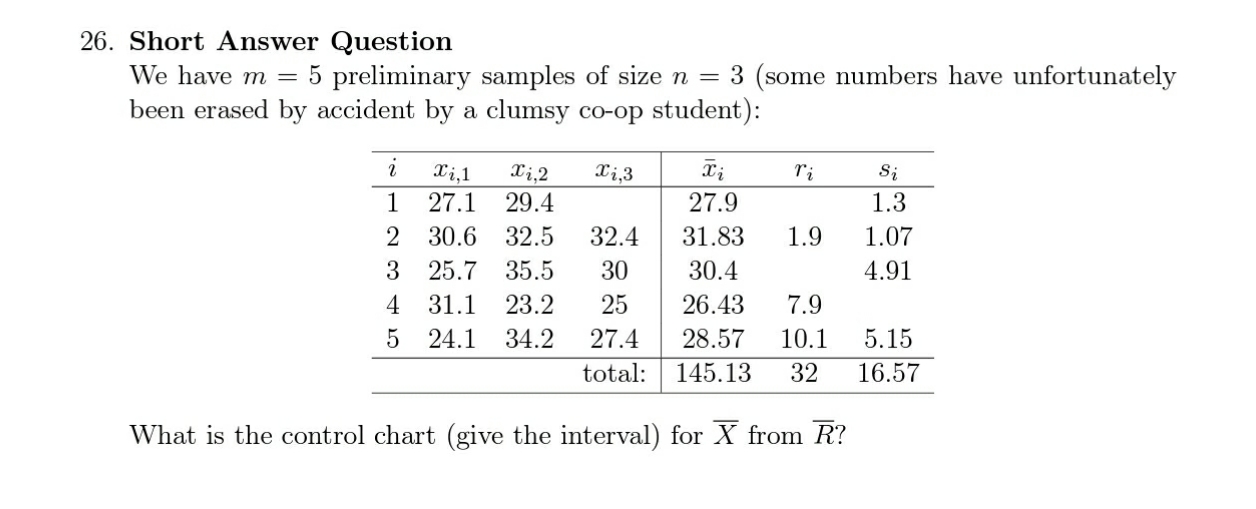
26. Short Answer Question We have m = 5 preliminary samples of size n = 3 (some numbers have unfortunately been erased by accident by a clumsy coop student): 2' 93:31 33:32 23:33 3: 1's S. 1 27.1 29.4 27.9 1 3 2 30.6 32.5 32.4 31.83 1.9 1 07 3 25.7 35.5 30 30.4 4 91 4 31.1 23.2 25 26.43 7.9 5 24.1 34.2 27.4 28.57 10.1 5.15 total: 145.13 32 16.57 What is the control chart (give the interval) for E from R
Step by Step Solution
There are 3 Steps involved in it
1 Expert Approved Answer
Step: 1 Unlock

Question Has Been Solved by an Expert!
Get step-by-step solutions from verified subject matter experts
Step: 2 Unlock
Step: 3 Unlock