

Question: Statistics Q3. The sample data below represent the number of late and on time flights for Delta, United, and US Airways. (Use a = 0.1)
Statistics
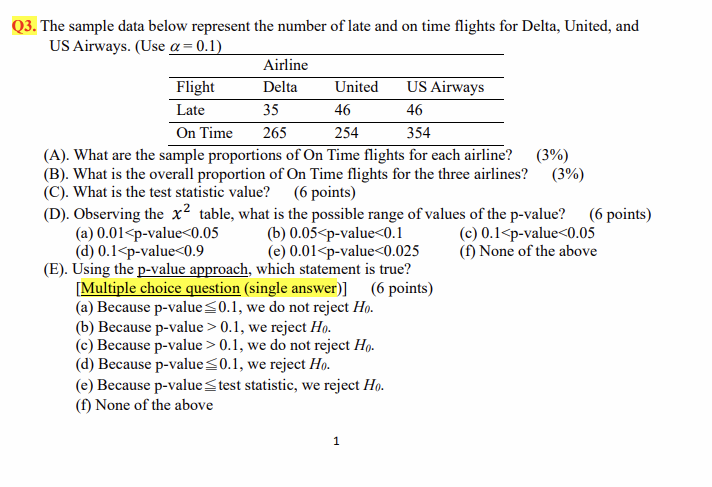
Q3. The sample data below represent the number of late and on time flights for Delta, United, and US Airways. (Use a = 0.1) Airline Flight Delta United US Airways Late 35 46 46 On Time 265 254 354 (A). What are the sample proportions of On Time flights for each airline? (3%) (B). What is the overall proportion of On Time flights for the three airlines? (3%) (C). What is the test statistic value? (6 points) (D). Observing the X table, what is the possible range of values of the p-value? (6 points) (a) 0.01
Step by Step Solution
There are 3 Steps involved in it

Get step-by-step solutions from verified subject matter experts