

Question: Statistics/ Quality Control Project TMA-100 Name: For this project we need to determine the out of control points from the rules in Chapter 11. Determine
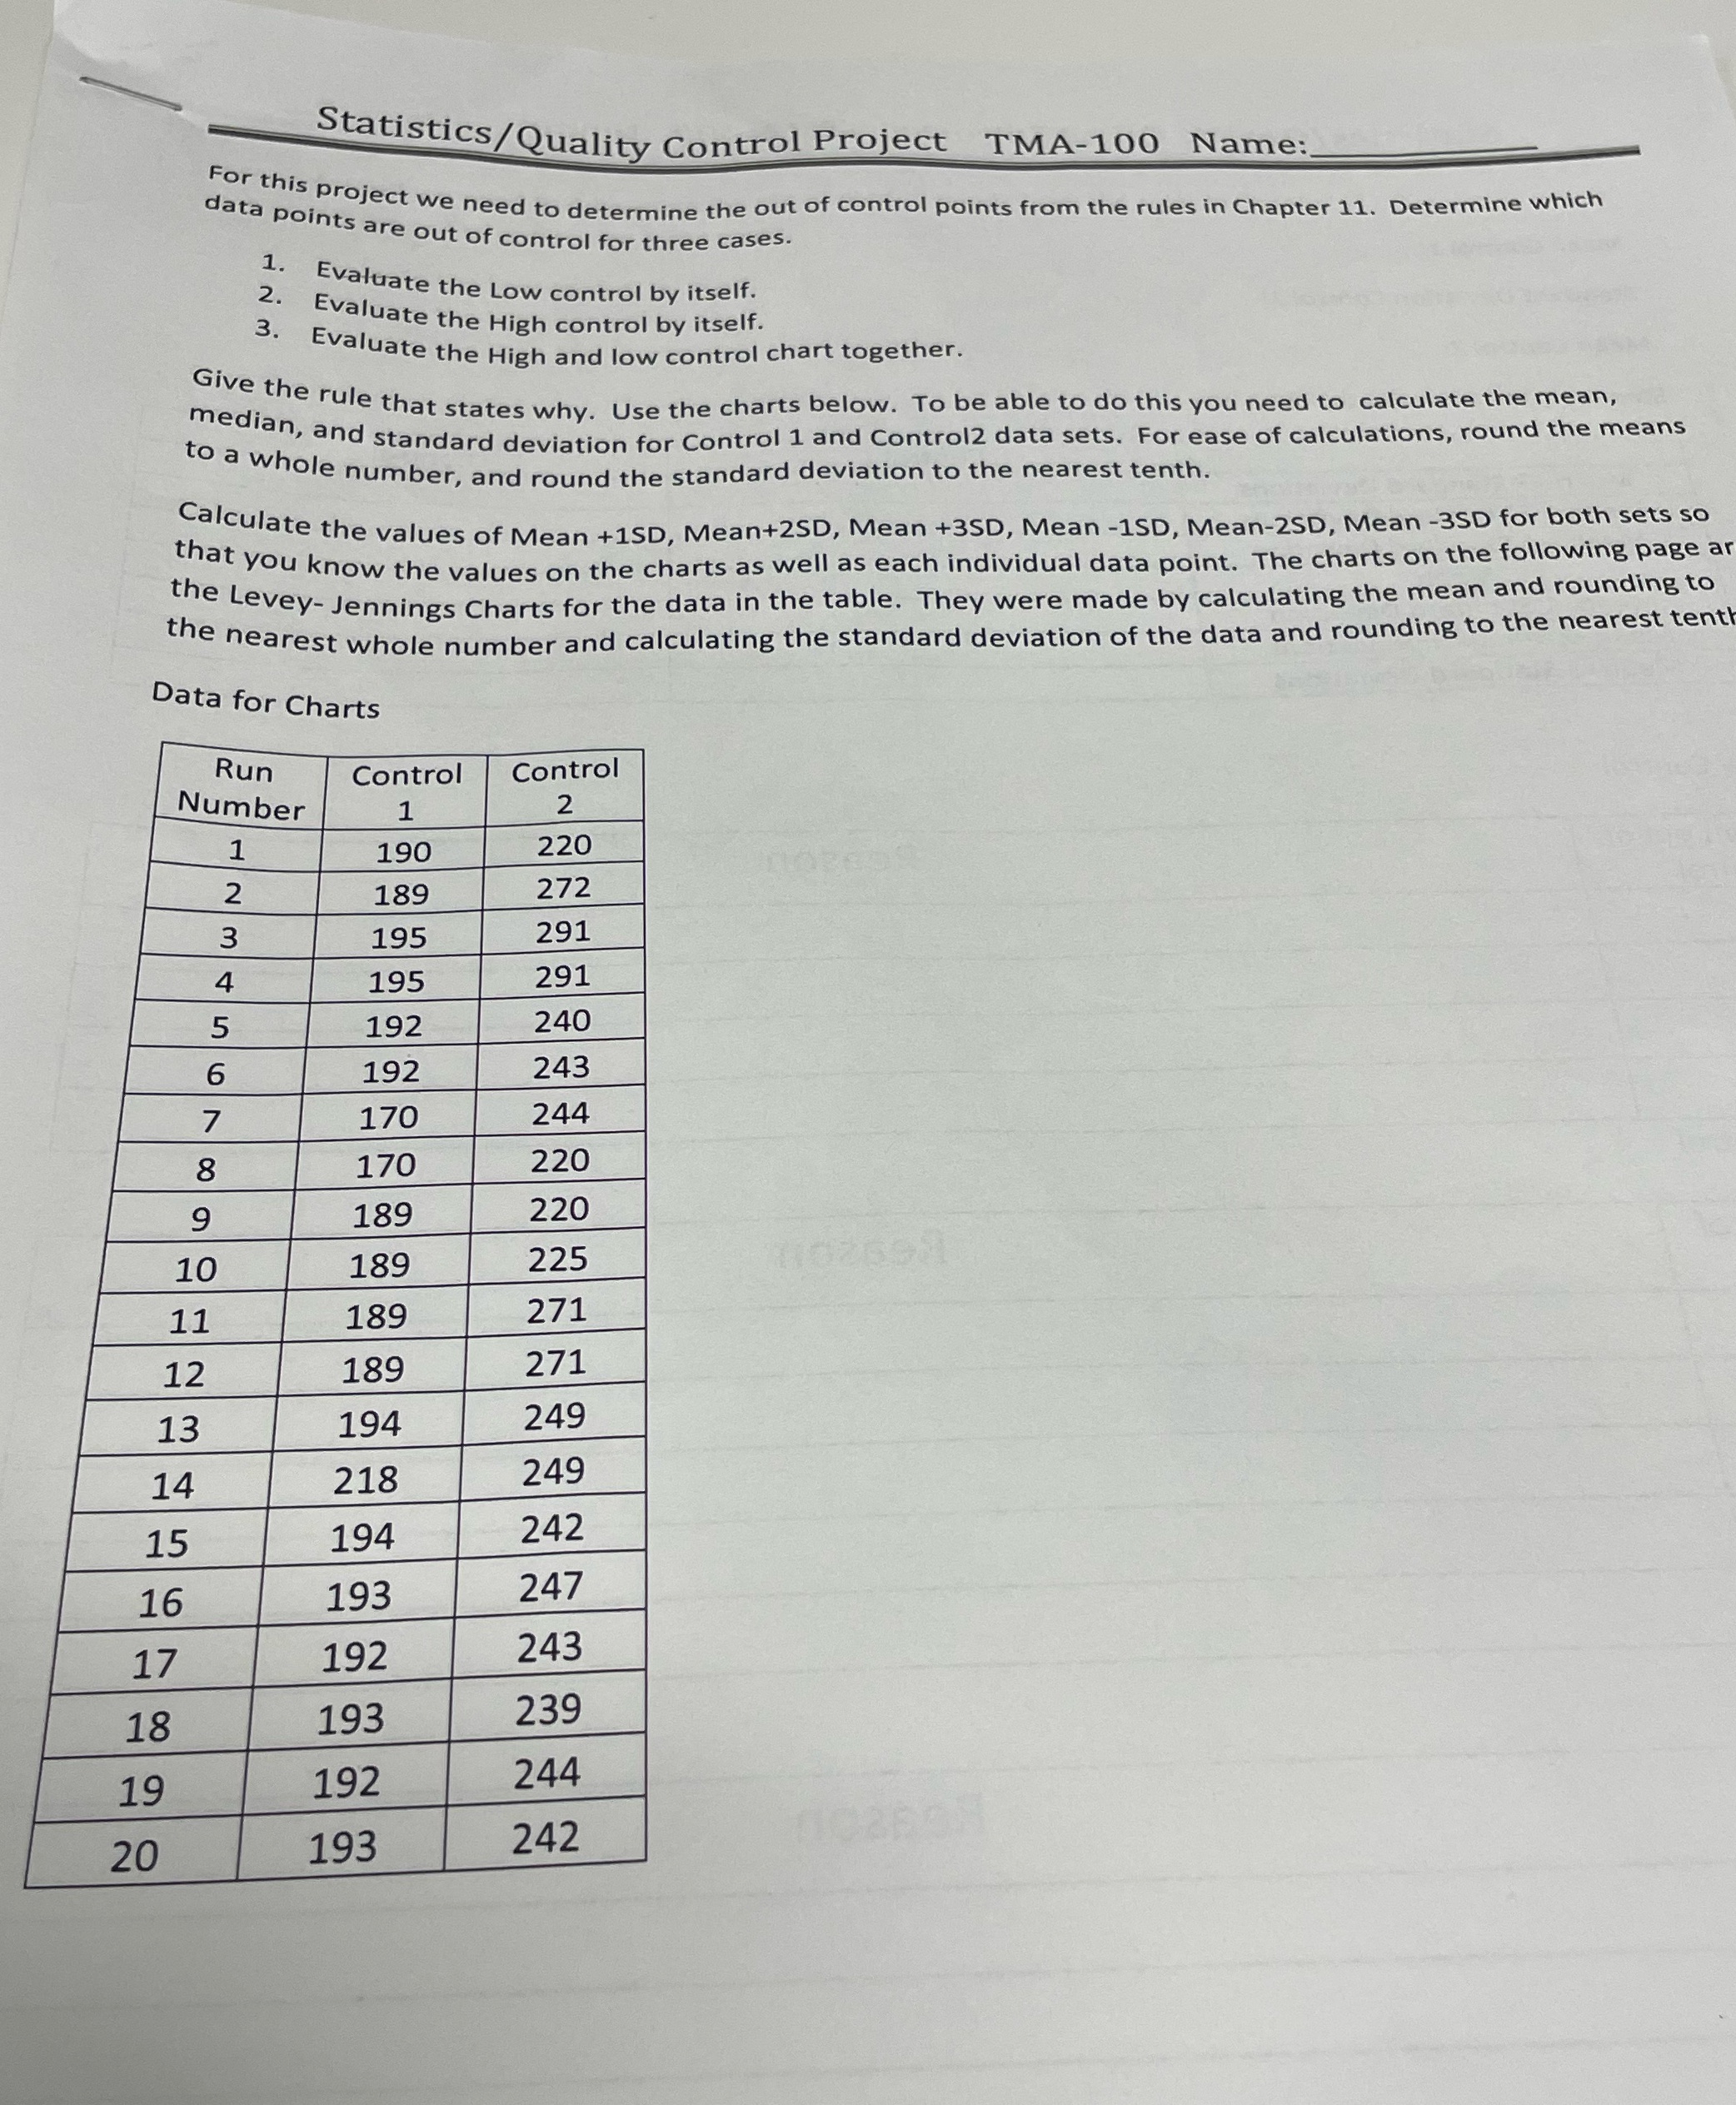
Statistics/ Quality Control Project TMA-100 Name: For this project we need to determine the out of control points from the rules in Chapter 11. Determine which data points are out of con t of control for three cases . 2 . 1. Evaluate the Low control by itself. Evaluate the High control by itself . Evaluate the High and low control chart together. give the rule that states why. Use the charts below. To be able to do this you need to calculate the mean, median, and standard deviation for Control 1 and Control data sets. For ease of calculations, round the means to a whole number, and round the standard deviation to the nearest tenth. Calculate the values of Mean +1SD, Mean+2SD, Mean +3SD, Mean -1SD, Mean-2SD, Mean -3SD for both sets so that you know the values on the charts as well as each individual data point. The charts on the following page ar the Levey- Jennings Charts for the data in the table. They were made by calculating the mean and rounding to the nearest whole number and calculating the standard deviation of the data and rounding to the nearest tent Data for Charts Run Control Control Number 2 1 190 220 2 189 272 w 195 291 4 195 291 5 192 240 6 192 243 170 244 8 170 220 9 189 220 10 189 225 11 189 271 12 189 271 13 194 249 14 218 249 15 194 242 16 193 247 17 192 243 18 193 239 19 192 244 20 193 242
Step by Step Solution
There are 3 Steps involved in it

Get step-by-step solutions from verified subject matter experts