

Question: statistics QUESTION 1 A random sample of * = 30 observations is drawn from a clinical trial. The following table shows readings oblained from the
statistics
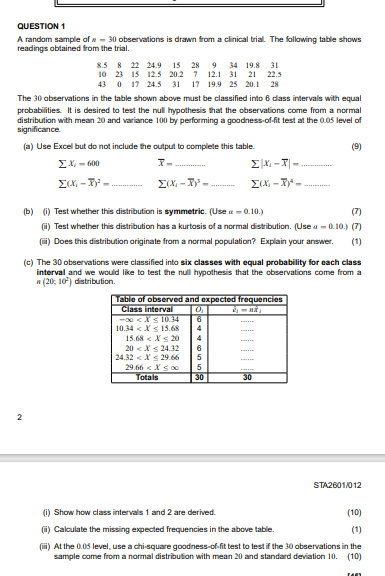
QUESTION 1 A random sample of * = 30 observations is drawn from a clinical trial. The following table shows readings oblained from the trial. 8.5 8 22 24.9 15 28 9 34 19.8 31 10 15 12.5 20.2 7 12.1 31 21 22.3 43 0 17 243 31 17 19.9 25 20.1 28 The 30 observations in the table shown above must be classified into & class intervals with equal probabilities. It is desired to test the null hypothesis that the observations come from a normal distribution with mean 20 and variance 100 by performing a goodness of fit test at the 0.0$ level of significance. (a) Use Excel but do not include the output to complete this table. EX- 600 (b) (i) Test whether this distribution is symmetric. (Use a = 0.10.) (7) (i) Test whether this distribution has a kurtosis of a normal distribution. (Use a = 0.10.) (7) [mii) Does this distribution originate from a normal population? Explain your answer. (1) (c) The 30 observations were classified into six classes with equal probability for each class interval and we would like to test the null hypothesis that the observations come from a # (20: 10) distribution. Table of observed and expected frequencies Class interval -co 's 1034 1034
Step by Step Solution
There are 3 Steps involved in it

Get step-by-step solutions from verified subject matter experts