

Question: statistics question a and b. The dataset is the 2nd textbook edition RockandRoll dataset off of statkey 3. Sampling Dist'n for the proportion of performers
statistics question a and b. The dataset is the 2nd textbook edition RockandRoll dataset off of statkey
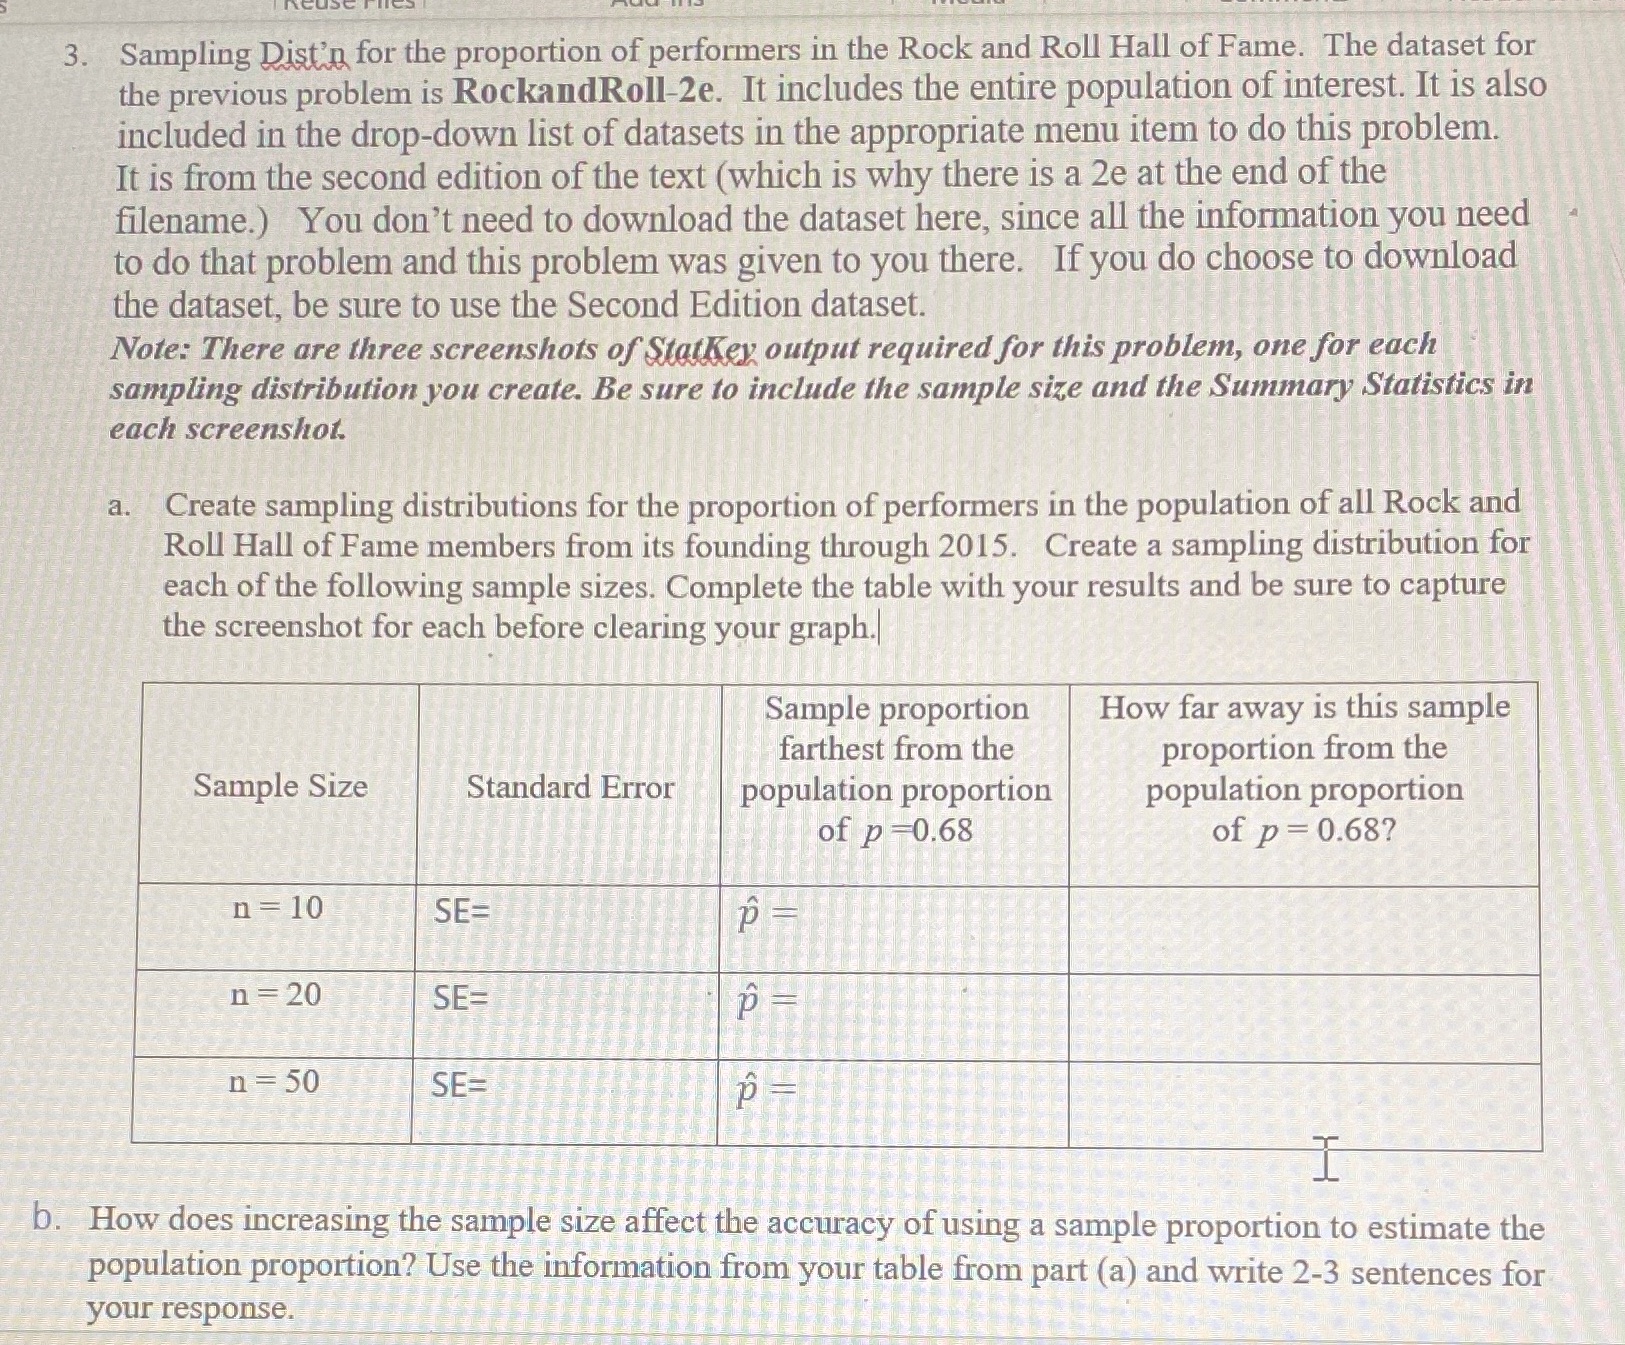
3. Sampling Dist'n for the proportion of performers in the Rock and Roll Hall of Fame. The dataset for the previous problem is RockandRoll-2e. It includes the entire population of interest. It is also included in the drop-down list of datasets in the appropriate menu item to do this problem. It is from the second edition of the text (which is why there is a 2e at the end of the filename.) You don't need to download the dataset here, since all the information you need to do that problem and this problem was given to you there. If you do choose to download the dataset, be sure to use the Second Edition dataset. Note: There are three screenshots of Statkey output required for this problem, one for each sampling distribution you create. Be sure to include the sample size and the Summary Statistics in each screenshot. a. Create sampling distributions for the proportion of performers in the population of all Rock and Roll Hall of Fame members from its founding through 2015. Create a sampling distribution for each of the following sample sizes. Complete the table with your results and be sure to capture the screenshot for each before clearing your graph.| Sample proportion How far away is this sample farthest from the proportion from the Sample Size Standard Error population proportion population proportion of p =0.68 of p = 0.68? n = 10 SE= P = n = 20 SE= p = n = 50 SE= p = b. How does increasing the sample size affect the accuracy of using a sample proportion to estimate the population proportion? Use the information from your table from part (a) and write 2-3 sentences for your response
Step by Step Solution
There are 3 Steps involved in it

Get step-by-step solutions from verified subject matter experts